LiveNX
End-to-end enterprise network observability platform
The article describes LiveNX, an end-to-end enterprise network observability platform designed to help network teams manage increasingly complex hybrid, multicloud, and remote environments by unifying and correlating data from applications, devices, and traffic flows. It addresses the real-world problem of data overload that hinders rapid issue isolation and resolution by offering real-time flow and packet-level analysis, AI-assisted insights, automated device discovery, and customizable dashboards to reduce mean time to repair and optimize performance. Key outcomes include improved visibility across underlays/overlays/tunnels and clouds, faster troubleshooting across multi-vendor domains, and extended capabilities via add-ons for device monitoring, AI assistance, remote packet capture, configuration automation, and security intelligence.
How does LiveNX help network teams reduce mean time to repair in complex hybrid and multicloud environments?
LiveNX reduces mean time to repair by unifying and correlating multiple data sets—flows, packets, device telemetry, and application activity—on a single platform so teams can move from a global view to a specific hop or packet for rapid root cause analysis. Real-time flow capture, predictive baselining, and end-to-end path analysis accelerate identification of anomalies and impacted services, while streamlined incident response workflows and optimized drilldown from visualization to packet-level detail shorten troubleshooting cycles. Add-ons such as LiveAssist provide AI-powered conversational assistance and intelligent alerts to further accelerate diagnosis and remediation across multi-vendor, multi-domain deployments.
What visibility and monitoring capabilities does LiveNX provide for multicloud and SD-WAN environments?
LiveNX provides broad visibility across underlays, overlays, tunnels, and multicloud deployments (including AWS and Azure), with automated device discovery and inventory creation to map hybrid assets. It visualizes devices, applications, VPNs, users, and overlay performance on network topology, enabling validation of WAN and SD-WAN performance through application and path visualization. Integrated monitoring covers QoS anomalies, traffic classification issues, Cisco QoS metrics, and IP telephony voice-quality monitoring, while dashboards and reports present health, bandwidth utilization, and security anomalies for operations, capacity planning, and executive views.
Which add-on modules extend LiveNX functionality and what operational problems do they address?
LiveNX offers several add-ons to extend monitoring and operational capabilities: Network Resource Monitoring delivers deep visibility into health and behavior of devices across hybrid environments (wireless, load balancers, switches, remote sites); LiveAssist provides AI-powered insights, an AI dashboard, conversational interface, intelligent alerts, and root-cause assistance to streamline troubleshooting; LiveWire adds high-performance packet capture and analysis for remote sites, WAN edge, branches, and data centers; LiveNCA (Network Configuration Automation) automates device discovery to build a comprehensive multi-vendor asset inventory; and Security Insights converts flow and packet data into real-time intelligence to enrich SIEM and XDR tools for better detection and response.
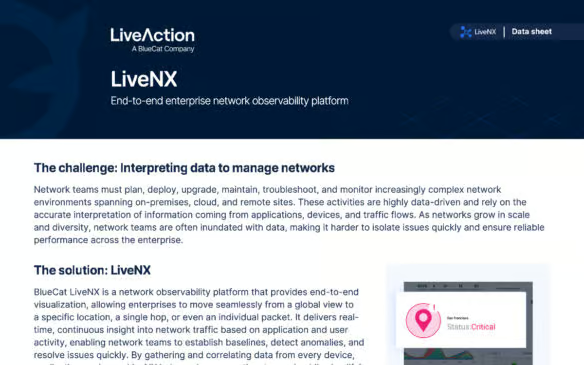
The solution: LiveNX
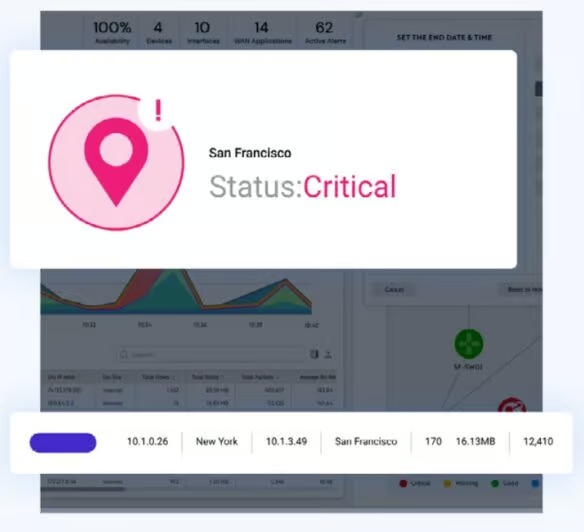
BlueCat LiveNX is a network observability platform that provides end-to-end visualization, allowing enterprises to move seamlessly from a global view to a specific location, a single hop, or even an individual packet. It delivers real-time, continuous insight into network traffic based on application and user activity, enabling network teams to establish baselines, detect anomalies, and resolve issues quickly. By gathering and correlating data from every device, application, and user, LiveNX helps reduce mean time to repair while simplifying troubleshooting across multi-vendor and multi-domain environments.
With LiveNX, enterprises can manage complex hybrid and multicloud networks with automation and AI-driven insights. It unifies and simplifies the collection, correlation, and presentation of application and network data, providing insights across the network that are actionable in real time. Network teams can resolve issues faster, reduce noise, and optimize network performance.
Add-on features can further extend LiveNX’s capabilities, such as delivering deeper visibility into the health and behavior of network devices across hybrid environments or providing AI-powered assistance with natural language conversations.
Features
Achieve network-wide visibility
Get complete visibility into network and application performance across multi-vendor, multi-domain, and multicloud networked environments for increased productivity and a better user experience.
Optimize performance
Proactively identify, troubleshoot, and quickly resolve network and application performance issues, regardless of where they occur, to speed time to repair, avoid costly downtime, and meet business needs.
Unify network data
Simplify monitoring and accelerate troubleshooting by unifying key types of network monitoring data, including network packets, on a single platform across the network, freeing network teams to focus on strategic work.
BlueCat’s Intelligent Network Operations (NetOps)
BlueCat’s Intelligent NetOps solutions provide the analytics and intelligence needed to enable, optimize, and secure the network to achieve business goals. With an Intelligent NetOps suite, organizations can more easily change and modernize the network as business requirements demand.