Network Resource Monitoring
Observability add-on combining network device health data, telemetry, and flow analytics for end-to-end visibility
 Key takeawaysKey takeaways are generated with AI assistance. Because automated summaries can occasionally contain errors or miss important context, always refer to the full blog post for complete information.
This solution brief describes Network Resource Monitoring, an add-on to LiveNX that unifies device health, telemetry, and flow analytics to provide end-to-end visibility across hybrid, multi-vendor networks. It addresses the real-world problem of fragmented network visibility and reactive troubleshooting by continuously collecting and correlating SNMP and vendor API telemetry from routers, switches, wireless, firewalls, and load balancers into LiveNX’s flow and topology intelligence. The combined outcome is faster troubleshooting, proactive capacity planning, reduced downtime, simplified multi-vendor operations, and a centralized, accurate device inventory that improves operational efficiency and user experience.
What types of telemetry and device data does Network Resource Monitoring collect and correlate with LiveNX?
Network Resource Monitoring collects and normalizes a broad set of operational telemetry and state data across routing, switching, wireless, firewalls, and load balancers. Collected items include CPU and memory utilization, interface utilization/errors/discards, environmental health (temperature, fans, power), routing and ARP tables, neighbor relationships (CDP/LLDP), VLANs, interface operational state, device inventory and configuration status. For wireless it gathers controller, access point, radio, SSID, client, RF, channel, and signal quality metrics. For firewalls and load balancers it collects high-availability status, VPN tunnel health, session statistics, virtual IPs, pools, service availability, and operational events, plus syslog/log events and configuration changes. All telemetry is correlated with LiveNX flow analytics and topology intelligence to produce unified, contextual insights.
How does Network Resource Monitoring improve troubleshooting and reduce mean time to resolution (MTTR)?
By continuously collecting real-time device and resource-level telemetry and correlating it with LiveNX flow and topology data, Network Resource Monitoring creates operational context that links device health to traffic behavior. This unified dataset lets engineers instantly see how device issues (for example an overloaded switch interface or failing access point) impact traffic paths and application delivery, eliminating manual data correlation across tools. Intelligent alerting that combines infrastructure alerts with routing, traffic, and topology reduces alert fatigue and highlights true root causes, enabling faster diagnosis, proactive remediation, and measurable reductions in MTTR and downtime.
What operational and business benefits result from deploying Network Resource Monitoring in multi-vendor environments?
Deploying Network Resource Monitoring provides consistent, centralized visibility across heterogeneous vendor environments (including Cisco, Arista, Aruba, Nokia, F5, Palo Alto Networks, Fortinet, and others), normalizing SNMP and API data into LiveNX. Operational benefits include automated device discovery and telemetry collection, accurate device inventory, proactive outage prevention through anomaly detection, and improved capacity planning using historical trends and LiveAssist analytics. Business outcomes are reduced operational overhead, lower risk of performance degradation, optimized infrastructure spend by avoiding over-provisioning, faster troubleshooting, higher availability, and the ability to reallocate NetOps resources to strategic modernization and optimization initiatives.

Challenge
Enterprises face fragmented visibility across hybrid networks. Traditional device monitoring tools operate in silos, leaving network teams blind to the connection between device health and performance. As a result, troubleshooting is reactive and inefficient.

Solution
Network Resource Monitoring, an add-on to BlueCat LiveNX, extends LiveNX’s traffic analysis capabilities with real-time telemetry from switches, routers, and wireless infrastructure. By combining device health data with flow analytics, NetOps teams gain end-to-end visibility for data-driven decision-making.

Benefits
How it works
Network Resource Monitoring extends network observability to the device and resource layer by continuously collecting and correlating device and resource-level telemetry with traffic and topology intelligence. It uses SNMP polling and vendor APIs to collect real-time and historical network infrastructure telemetry across Cisco, Arista, Aruba, Nokia, F5, Palo Alto Networks, and Fortinet environments.
The following table details the types of telemetry data collected:
| Device category | Telemetry data collected |
|---|---|
| Network infrastructure |
|
| Wireless infrastructure |
|
| Firewalls |
|
| Load balancers |
|
| Operational events |
|
Use cases
This section outlines five real-world scenarios that demonstrate the benefits of using Network Resource Monitoring with LiveNX.
Use case 1: Boosting operational efficiency through automation
Maintaining accurate device inventories and manually collecting telemetry are time consuming and error-prone. In fast-
changing environments—where devices are constantly added, reconfigured, or retired—manual updates quickly fall out of sync. Networks Resource Monitoring automates both discovery and telemetry collection, continuously scanning the network to identify connected devices, classify their roles, and capture key metrics in real time. All data flows directly into LiveNX’s unified model, keeping visibility up to date without manual effort. This automation saves time, reduces the risk of misconfiguration, improves compliance readiness, and ensures that monitoring scales as networks grow.
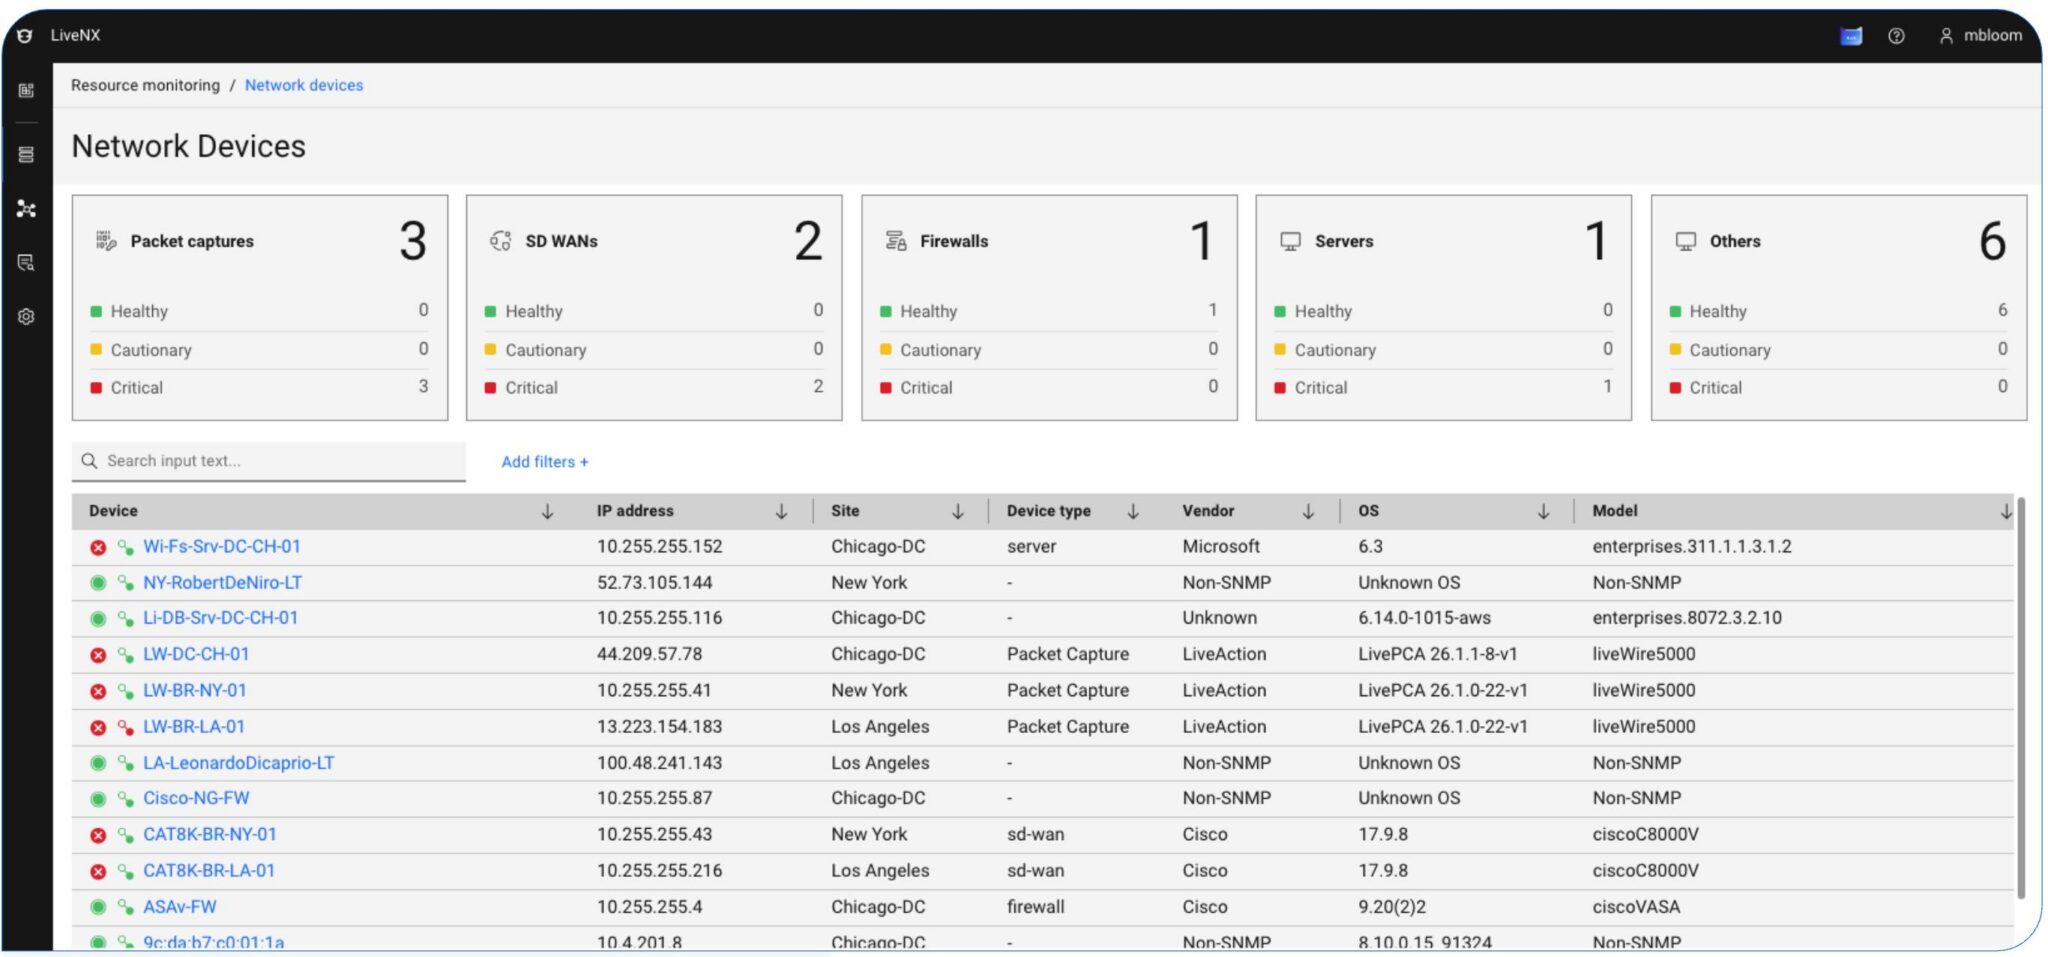
Figure 1. Network Resource Monitoring network devices dashboard
Outcome: Significant gains in productivity, reduced manual overhead, and accurate, up-to-date network intelligence. Network teams can reallocate resources to higher-value initiatives such as optimization, capacity planning, and strategic modernization.
Use case 2: Proactive outage prevention
Most network teams still operate in a reactive mode, responding to alerts only after users report performance degradation. Network Resource Monitoring changes this by continuously monitoring key device health metrics, including CPU, memory, temperature, and interface utilization. When anomalies arise, Network Resource Monitoring automatically correlates them with network performance trends in LiveNX, highlighting at-risk components before they fail. Instead of chasing complaints, NetOps teams can proactively remediate issues—from overworked switches to unstable access points—before they escalate into outages.
Outcome: Reduced downtime, faster detection of emerging problems, and improved end-user experiences. Enterprises can move from reactive firefighting to preventive operations that protect uptime and service quality.
Use case 3: Smarter capacity planning
Without visibility into device utilization and performance trends, many organizations either over-provision resources or experience unexpected bottlenecks. Network Resource Monitoring feeds continuous telemetry data into LiveNX’s traffic analysis feature. The AI capabilities of LiveAssist, a separate AI-powered analytics add-on for LiveNX, correlates data for trend analysis. This allows teams to forecast demand, identify capacity risks, and confidently plan upgrades. Historical data helps predict when a router’s throughput will reach its limit or when a wireless controller will need to be expanded.
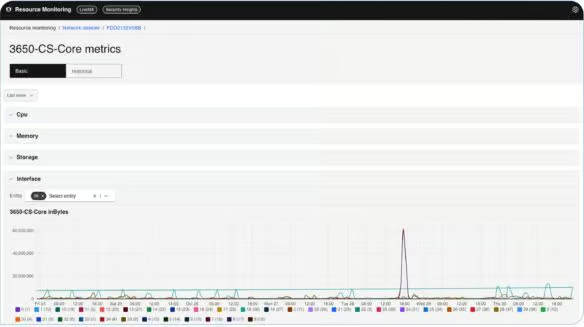
Figure 2. Network Resource Monitoring device metrics dashboard
These insights also feed into budget and resource planning, ensuring investments are data-driven rather than reactive.
Outcome: Optimized capacity and cost management. Network teams avoid overspending on unnecessary infrastructure while preventing performance degradation from under-provisioned resources.
Use case 4: Unified device and flow visibility
Enterprises managing complex hybrid environments often rely on multiple disconnected tools: one for device health, another for traffic analysis, and a third for application performance. This fragmentation creates blind spots and slows troubleshooting. With Network Resource Monitoring, LiveNX becomes the single pane of glass for both network and infrastructure insight. Device telemetry collected through SNMP and APIs is automatically correlated with LiveNX’s flow analytics and topology views. Teams can instantly see how a failing router interface or overloaded switch affects traffic paths and application delivery.
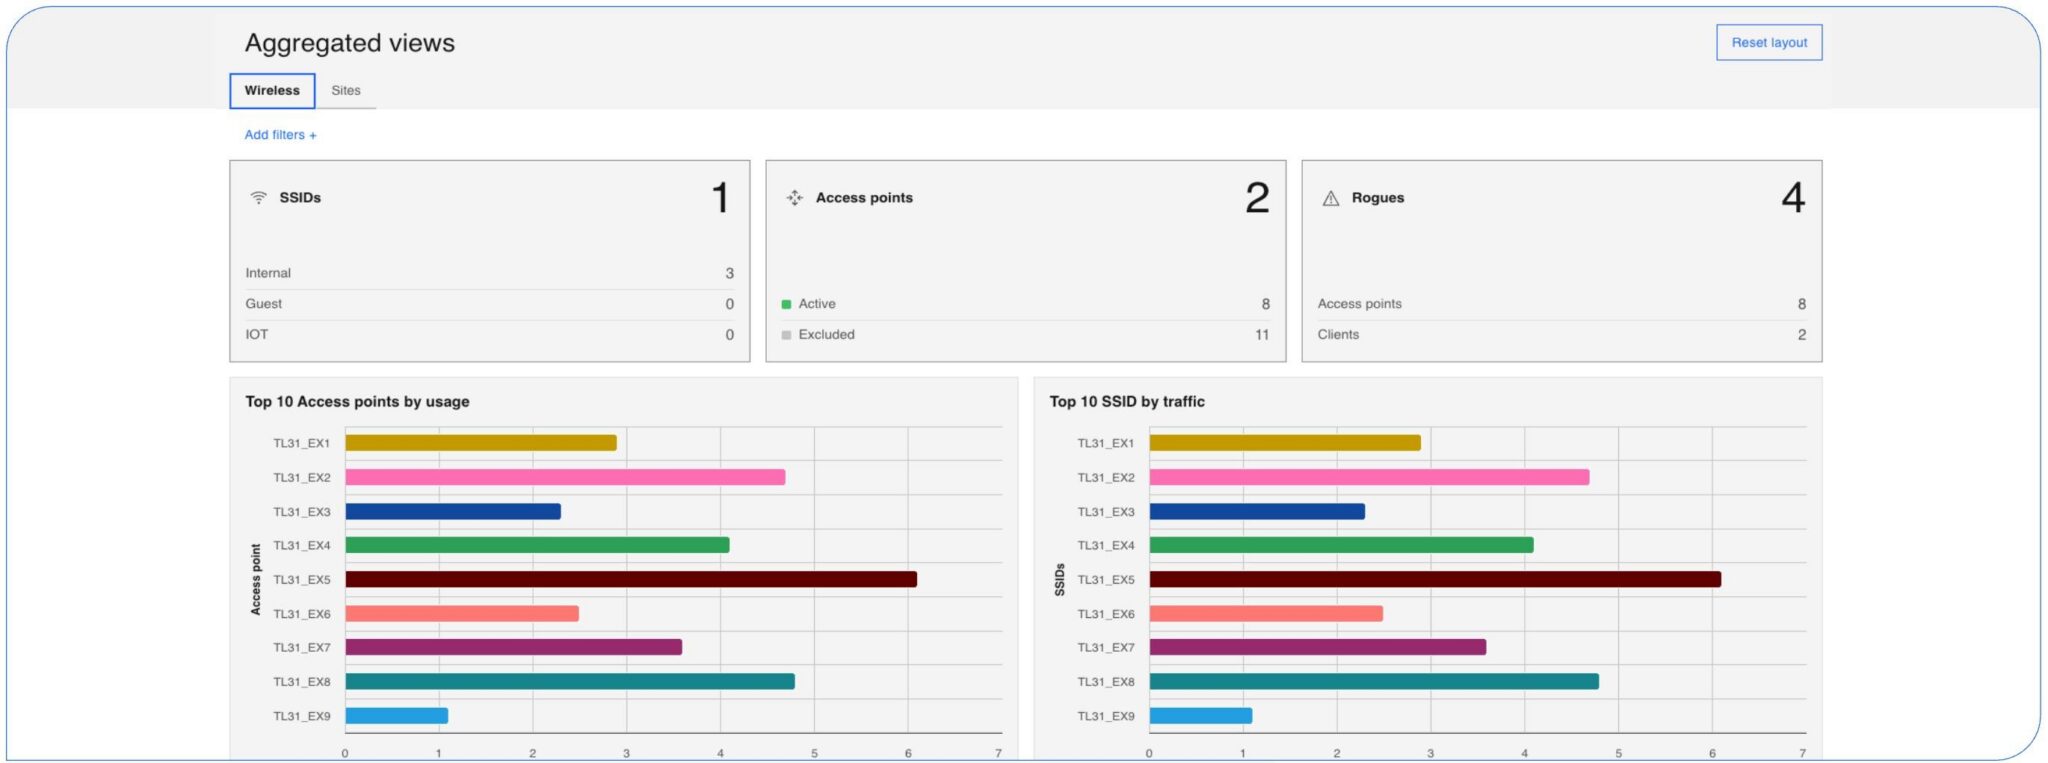
Figure 3. LiveNX dashboard showing unified device flow and visibility between network and infrastructure
Outcome: End-to-end visibility that bridges the gap between devices, flows, and applications. By consolidating toolsets, teams reduce MTTR, eliminate redundant systems, and operate from a unified, trustworthy source of truth.
Use case 5: Simplified multi-vendor operations
Large enterprises rarely operate in single-vendor environments. A typical hybrid network might include Cisco and Arista switches, Aruba wireless infrastructure, and Nokia service aggregation routers. Each vendor’s tools produce data in different formats, leading to inconsistent visibility and analysis. Network Resource Monitoring unifies multi-vendor telemetry on a single platform, normalizes SNMP and API data from diverse sources, and correlates it with flow and topology intelligence in LiveNX. This ensures teams can compare device performance side by side and apply consistent monitoring policies across environments.
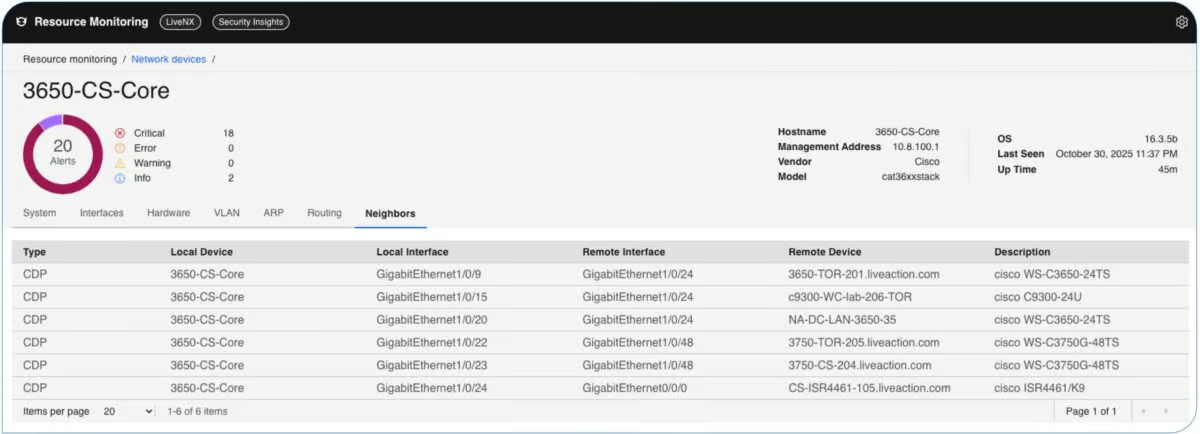
Figure 4. Network Resource Monitoring dashboard showing neighboring Cisco network devices
Outcome: Seamless cross-vendor visibility and operational consistency. Teams spend less time reconciling data across systems and more time optimizing performance and reliability.
Key differentiators
Network Resource Monitoring isn’t just another SNMP polling tool—it’s a device observability engine built to extend LiveNX’s full-stack intelligence. It stands apart due to its unique combination of:

Operational data foundation
Network Resource Monitoring serves as the primary source of operational infrastructure data for BlueCat’s network observability platform, continuously collecting rich operational information across routing, switching, wireless, firewalls, load balancers, alerts, logs, and operational state.

Rich operational context
Network Resource Monitoring captures far more than infrastructure health. It continuously builds operational context describing infrastructure state, service health, routing behavior, wireless connectivity, and critical network services.

AI-powered
Leveraging Network Resource Monitoring’s rich operational context, LiveAssist helps engineers investigate issues using natural language, identify root causes, and accelerate troubleshooting through AI-assisted recommendations.

Intelligent alerting
Infrastructure alerts become significantly more valuable when viewed alongside operational state, routing information, network traffic, and topology. This contextual approach reduces alert fatigue and accelerates troubleshooting.

Open multi-vendor architecture
Network Resource Monitoring provides consistent operational visibility across heterogeneous environments, including Cisco, Arista, Aruba, Nokia, F5, Palo Alto Networks, Fortinet, and other supported platforms.
Solution benefits
Network resource monitoring enables IT teams to ensure availability, reduce risk, control costs, and deliver better user experiences by providing continuous, actionable insight into infrastructure health and utilization. Key benefits include:

Improved performance and availability
Monitoring of core devices and key performance metrics complements LiveNX’s network-centric observability, enabling proactive detection of bottlenecks and ensuring higher uptime.

Optimized capacity and cost
management LiveAssist’s trend analysis of device information that is sent from Network Resource Monitoring to LiveNX supports capacity planning, bandwidth optimization, and over-provisioning prevention—reducing both outages and unnecessary spending.

Operational efficiency Automated discovery
telemetry collection, and alerting minimize manual effort, allowing teams to focus on strategic initiatives and boost productivity.

Proactive operations Detection and
prevention of device-level failures before users are impacted.

Hybrid and multi-vendor visibility
Unified monitoring across on-premises, SD-WAN, wireless, and cloud devices from multiple vendors—including switches, routers, and wireless access controllers from Arista, Cisco, Aruba, and Nokia—ensures consistent visibility across complex environments.
AI-powered intelligence Every metric
collected by Network Resource Monitoring is sent to LiveNX. There, with the help of LiveAssist, you can ask natural-language questions and receive real-time insights, intelligent alerts, and root cause assistance to streamline troubleshooting and optimize performance.
BlueCat’s Intelligent Network Operations (NetOps)
BlueCat’s Intelligent NetOps solutions provide the analytics and intelligence needed to enable, optimize, and secure the network to achieve business goals. With an Intelligent NetOps suite, organizations can more easily change and modernize the network as business requirements demand.