How to Troubleshoot Check Point Firewall VPN Connection
Looking for a step by step guide on how to troubleshoot a VPN connection for Check Point Firewalls? Read Johnathan Browall’s detailed post with pictures here.

Notice: This blog post was originally published on Indeni before its acquisition by BlueCat.
The content reflects the expertise and perspectives of the Indeni team at the time of writing. While some references may be outdated, the insights remain valuable. For the latest updates and solutions, explore the rest of our blog
In this example the tunnel between GWA (Gateway A) and GWB (Gateway B) is down. Both gateways could be managed by the same management server, or different ones. Both could be Check Point Firewalls or one could be another brand.
Since at least one gateway needs to be a Check Point gateway managed by us, in this example this is GWA. GWB can either be another one of our gateways or an external one.
SmartView Monitor
Let’s see what this has to say about the tunnel. (Viewing VPN tunnels in SmartView Monitor requires a monitoring license installed on the management server, and enabled on the gateway itself).
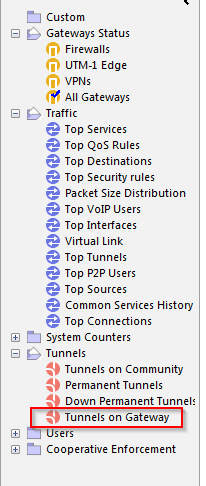
Open the SmartView Monitor and go to “Tunnels on Gateway”:

First select GWA in the list and review if the tunnel in question is UP, DOWN or Up – Init. Up – Init means that it is trying to establish the tunnel, and will probably mean that in a few seconds the tunnel will go to DOWN state or UP state.
Now go to “Tunnels on Gateway” again and select GWB (if both gateways are managed by the same management server).
Learn how indeni enables pre-emptive maintenance of Check Point Firewalls
One issue we could see here is for example that the tunnel is UP from GWA perspective, but DOWN from GWB perspective. If the “Permanent tunnel” is activated on the VPN community (both gateways need to be Check Point) they will exchange UDP tunnel test packages (Name: tunnel_test, UDP/18234). If GWA does not receive these packets, it will think the tunnel is down.
However we could be in a situation where packets from GWA to GWB arrive, but not in the opposite direction (GWB to GWA). We will then see that the tunnel looks to be up from one side, but not the other. The reason for this is packets lost in transit, maybe due to DDoS protections, routing on internet or other issues.
If we have a tunnel from our Check Point gateway (GWA) to a non-check point gateway (GWB) we cannot use permanent tunnels. This means that the tunnel will be down, and not appear in this list until traffic is sent in it.
So why it is down could be as simple as no traffic has been sent into the tunnel. Another issue could arise if GWB is not a Check point gateway, but the permanent tunnel is activated anyway. The tunnel will then show as down from GWAs perspective since it assumes that GWB will send the tunnel test packages.
SmartLog/SmartViewTracker
Sort traffic with GWA as source, and GWB as destination. Then also check the other way around, GWA as destination and GWB as source.
Here we could see if the PSK (pre-shared key) is incorrect for example, or if IKE packets are dropped. If the PSK is incorrect, make sure both sides have the same PSK and remember that it cannot be longer than 64 characters (longer than that and it will be cut off at 64 chars, see sk66660 on the Check Point support portal.
If the tunnel broke suddenly, check drops from the time the tunnel stopped working. There can be situations where the drop log is not shown repeatedly. The most common thing you would see here is the not so friendly error “Packet is dropped because there is no valid SA – please refer to solution sk19423 in SecureKnowledge Database for more information“. This means that the two gateways did not reach an agreement. This is due to the fact that the proposals are different between the gateways. The proposal contains for example the subnets in the encryption domain.
The most common issue in Check Point has to do with something called super netting. To understand why Check Point does this, we need to understand how a VPN tunnel works. In a VPN tunnel one Phase1 will be established and then one Phase2 per subnet pair. If you have two /24 subnets on each side of the tunnel that need to speak to each other, that is 4x Phase2. Check Point will create as few subnets as possible and therefore it will create one /23 subnet instead of 2x /24 if possible. If the other side of the tunnel has 2x /24 configured and the Check Point have one /23 in its proposal the tunnel will fail. It’s not easy to check the proposals in the Tracker or SmartLog, so for that we need to debug the VPN tunnel and check out the debug file with IKEView (see next section below).
If you get the error “invalid certificate” then the port 18264 is closed between the gateway and management server. This port is used for GWA to verify GWB’s certificate in the case that both are managed by the same management server. Then they do not use PSK.
IKEView
If we cannot establish why the tunnel fails with the above methods we need to take a better debug. You can refer to: sk63560 on the Check Point support portal. Below is a summary.
On the active gateway, run:
# vpn debug trunc
Now a debug file will be created at: $FWDIR/log/ike.elg and $FWDIR/log/ike.elg.0
Do some resets on the tunnel to get some data into this or of the tunnel is down, try to make it establish the tunnel again by sending data into the tunnel, then download the ike.elg file to your desktop and open it with IKEView (available from Check Point support site). If you do not have the monitoring license to SmartView Monitor you can use the CLI command:
# vpn tu
to reset tunnels on GWA. Select option (7) Delete all IPsec+IKE SAs for a given peer (GW) and input GWBs IP address. In this program you will see what data is being sent between the gateways, what proposals etc., to see if there is anything not matching. It is sorted on the remote gateway IP, and you can follow both what proposal GWA sends to GWB and also what GWB sends to GWA. End the debug with:
# vpn debug off # vpn debug IKEoff
Optionally delete $FWDIR/log/ike.elg* to not have old things in it the next time you troubleshoot.
zdebug
Another tool we can use is zdebug. This is a tool for checking dropped packets and reasons.
Do you wonder why it’s called zdebug? Apparently the person who wrote this program had a name starting with Z.
There are times when we can have drops which are not logged in the normal log, or the reason is not properly stated there. Then zdebug is helpful. Go to GWA and run (in expert mode):
# fw ctl zdebug drop | grep IP_OF_GWB
This will show if we have any dropped IKE packets etc. Example output:
;[cpu_5];[fw4_0];fw_log_drop_ex: Packet proto=17 REMOVED:500 -> REMOVED:500 dropped by fwpslglue_chain Reason: PSL Drop: ASPII_MT; ;[cpu_5];[fw4_0];fw_log_drop_ex: Packet proto=17 REMOVED:500 -> REMOVED:500 dropped by fwpslglue_chain Reason: PSL Drop: ASPII_MT; ;[cpu_5];[fw4_0];fw_log_drop_ex: Packet proto=17 REMOVED:500 -> REMOVED:500 dropped by fwpslglue_chain Reason: PSL Drop: ASPII_MT;
You can then search on the Check Point user center for the part “fwpslglue_chain Reason: PSL Drop: ASPII_MT” and you will in this example find issue sk90322 which explains the issue and the solution for this specific example.
If nothing else works
If nothing can be solved by the methods above and if time is critical there are some emergency measures that can be taken:
• Fail over the cluster (if it is a cluster)
• Push policy
• Delete the Community and re-create it
• Make sure you use IKE v1 in the Community
We have hundreds of automation elements to prevent problems from occurring in your environment. When a VPN tunnel is down, we can automatically kick off investigative steps to determine the root cause of the problem, without human intervention. We provide prescriptive remediation steps to fix the VPN tunnel down problem. Check out our top picks for Check Point firewalls automation.
Johnathan Browall Nordström is the Team Lead of Network & Security at Betsson Group. He has been working with Check Point firewalls for more than four years. If you want to contribute as well, click here.


