Indeni 8.1 Analytics Dashboard & Network Security Automation

New Platform Capabilities
1 – Analytics Dashboard
We’ve been performing return on investment analysis using data from alert exports for business decision makers for many years. We recently started doing technical analysis with the same alert export data to help technical decision makers make more informed decisions based on data. The purpose is to identify problematic devices, types of issues, top alerts, etc. to help you optimize your environment and identify new projects for improvements. This exercise led to the development of an analytics dashboard. We’re very excited to share the first phase of our analytics dashboard journey.
Issues At-A-Glance
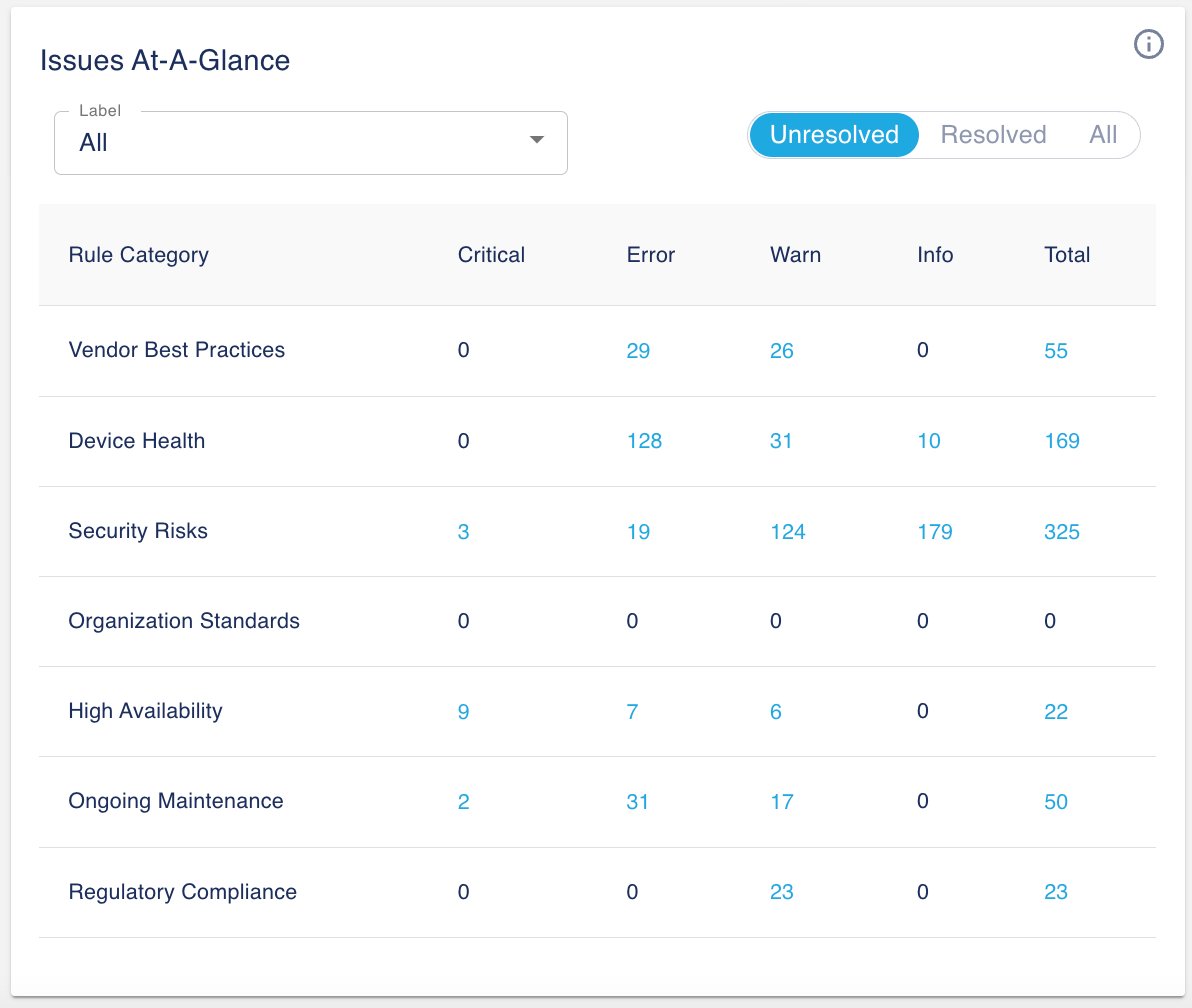
The first table we created from the technical analysis is a summary of the issues organized by Rule Category and Severity. It is the mental model that helps us quickly process the information about potential problems in your environment.

In this example, you can see that you have many device health and security related issues. You probably want to immediately act on the health related issues and consider starting a device hardening project given that security related issues are the number one in the list. Besides this, the high number of issues related to Vendor Best Practices is quite alarming. Maybe it’s time to look at a new project which will potentially minimize disruptions.
The table is interactive. You can filter using labels (default is system-all) to limit the data to a subset of devices. You can factor unresolved issues (default), resolved issues or both. Drill down to explore further by clicking any cells in the table. For example, if you click on the 2nd column (Critical) the 6th row (High Availability) it will take you to the issues page displaying the nine critical High Availability alerts.
Top 10 Devices With the Highest # of Issues
The heatmap is a great way to show the top devices with the most issues and the distribution in terms of severity. Similar to the Issues At-A-Glance widget, you can set filters to limit the number of devices and the list of issues. You can mouse over to any part of the heatmap to see the actual value of the alerts. Clicking on any one of the boxes on the heatmap will take you to the issues page with the corresponding filters for further drill down and analysis.
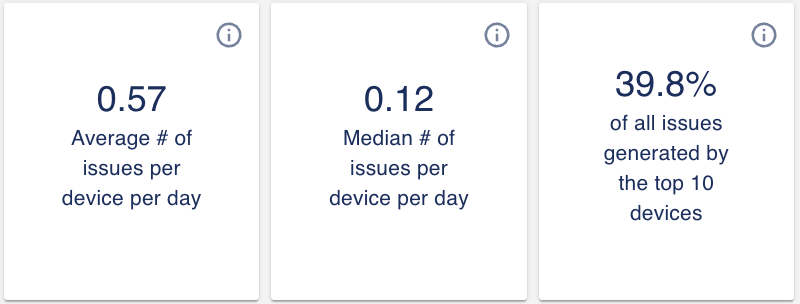
From the alert export technical analysis, we discovered that many customers have ‘problematic’ devices. If you use the three widgets just above the heatmap, you can quickly identify if you have problematic devices in your environment.

If the average number of issues per device per day is significantly higher than the median number of alerts, that is indicative of problematic devices. The 3rd widget shows the percentage of alerts generated by these top devices. With these three widgets along with the heatmap, you can quickly identify problematic devices in your environment.
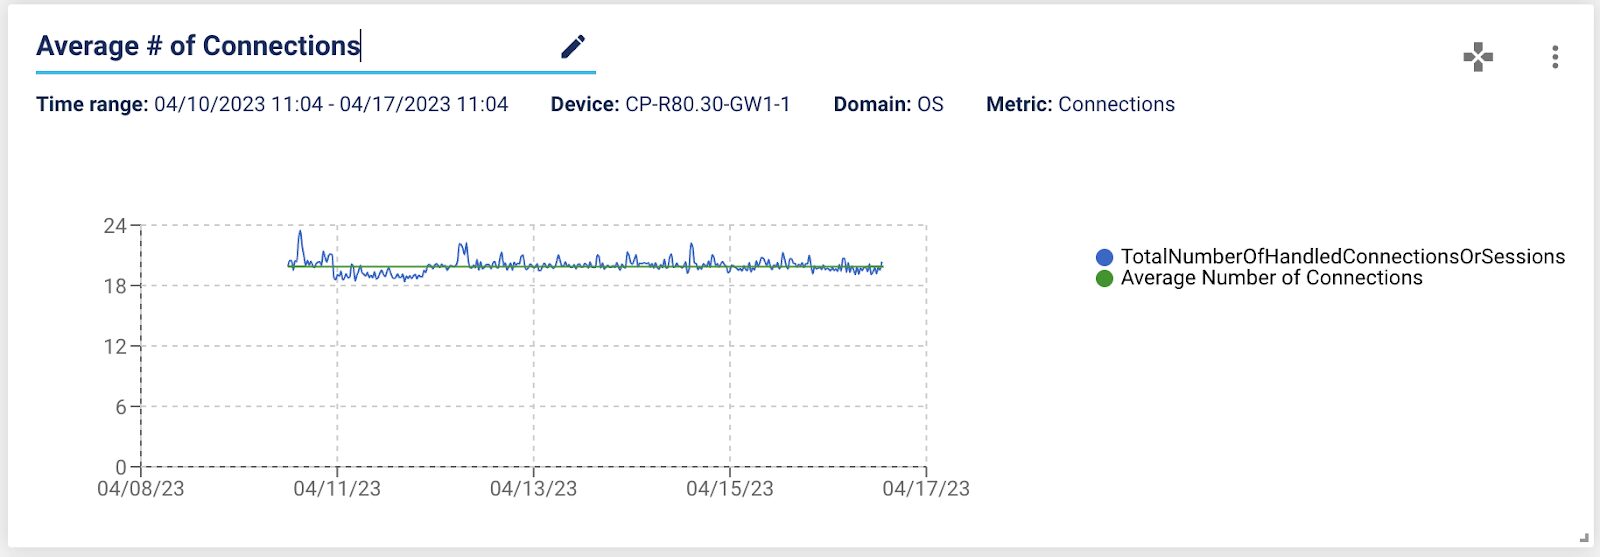
3 – Connection Counts with an average line
We have a couple of graphs showing connection counts along with the limit. This new graph adds a new line to show the average number of connections over time.

4 – Upgrade Process Improvements
The new enhancement removes the manual steps simplifying the offline upgrade. The new process automatically uses the most recent version of the packages in the directory: latest.tar.gz and indeni.latest.tar.gz. You no longer need to manually unpack and install indeni-triton.deb.
We also made enhancements to maintain references to your issued certificate parameters: keystore and passphrase. This enhancement applies to all upgrades (Online & Offline).

During the upgrade, we introduce new configuration files that will not be overwritten. Typical config file changes include using the customer’s signed certificate for the UI, email notification only for new alerts and the number of backups to retain. With this enhancement, you no longer need to manually backup and restore these files during the upgrade.
Note: After the upgrade, the relevant manual changes will need to be inserted into the persistent files instead of making the changes in the default configuration files. For more details, see Offline Upgrade.
Network Security Automation
1 – Check Point
1.1 New Check Point Release
Support for Check Point devices now extends from earlier versions of GAiA to the latest release R81.20. The release delivers significant innovations in Advanced Threat Prevention, Security management, and Security Performance. For more information, visit Check Point Support Center.
1.2 New Auto-Detect Elements for Check Point Secure Gateways
- Alert if IPS is bypassed
- Alert if Dynamic Balancing Status is “OFF”
- Monitor the status of the Identity Awareness PDP Broker
- Alert on Domain Objects without FQDN
1.3 Updates/Improvements
- The “repeated failed login attempts” rule was improved to include the source IP address alongside with the user-name. A threshold was also added for the number of repetitions in the last hour with a default of 5 attempts
Note: the value was 1 and previously hard-coded
2 – Palo Alto Networks
2.1 New Release
Support for Palo Alto Networks NGFW now extends from earlier versions of PAN-OS to the latest release 11.x Nova. Nova introduces innovations to help stop zero-day threats and simplify security architectures. For more information, Introducing PAN-OS 11.0 Nova.
2.2 New Auto-Detect Elements for NGFW
- Alert if primary static route not configured
- Alert when path-monitor is down
- Alert if an interface in an aggregated link is flapping
This script scans the system log file to retrieve information about link state changes. If two or more state changes within the monitoring interval of 15 mins are detected, it’s indicative of a flapping link.
2.3 New Auto-Detect Elements for Panorama
- Alert if commit not scheduled
This relatively new feature was introduced in 10.1.0. It allows you to create a scheduled configuration push to automatically push changes to firewalls on a specified date and time. You can configure a scheduled configuration push to either once or to push on a regularly occurring schedule. This alert is created if the commit is not scheduled.
- Alert if scheduled commit failed
Similar to above, this alert is created if the commit fails.
- Alert when Panorama fails to connect to Active Directory servers
- Added HIGH severity CVE alert CVE-2022-0030 PAN-OS: Authentication Bypass in Web Interface
3 – Broadcom Blue Coat ProxySG
Alert if the total content analysis requests are low in a 15 minutes window. You must configure the threshold for this rule to take effect.