DDI Analytics
Map your entire DDI environment with visual-first metrics embedded in Integrity
The article introduces DDI Analytics, an add-on for BlueCat Integrity that provides visualization-first monitoring and analytics across DNS, DHCP, and IPAM to help enterprises detect capacity risks, performance issues, and anomalies before users are impacted. It maps Address Manager, BlueCat DNS/DHCP Servers, services, sites, and cloud DNS into a single interactive topology with real-time metrics, heatmaps, model-aware thresholds, and forecasting to speed troubleshooting and capacity planning. The solution reduces operational friction by centralizing global and appliance dashboards, DHCP talker and whitespace analysis, license metering, and cloud DNS forensic filters so teams can spot hotspots, predict saturation, and prioritize corrective actions quickly.
How does DDI Analytics help teams detect and prevent capacity saturation across DNS, DHCP, and IPAM?
DDI Analytics provides built-in capacity forecasting that uses recent utilization history to project future trends, enabling teams to spot saturation risks early and plan upgrades or range changes proactively. The global dashboard surfaces system-wide KPIs—queries per second, leases per second, active IPs, and Top‑N utilization—so operators see capacity trends across the Integrity deployment. Model-aware thresholds on appliance dashboards and heatmaps instantly flag load or error conditions, while whitespace analysis visualizes unused address space and fragmentation to support right‑sizing and network planning before users experience impact.
What tools does DDI Analytics provide for troubleshooting DNS and identifying anomalous or abusive traffic?
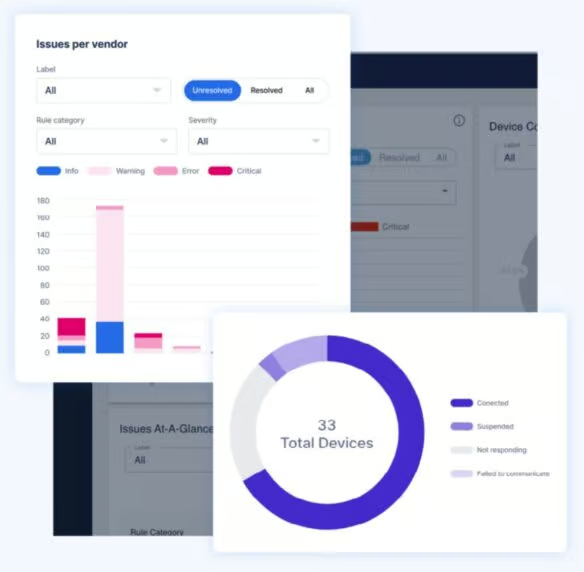
DDI Analytics embeds cloud DNS analytics and detailed drilling capability into Integrity, showing total queries, average QPS, and geographic heatmaps by data center. Operators can filter by zone, query name, query type, return code, source IP, or destination IP to investigate spikes, routing issues, or suspicious activity, including potential DDoS. Appliance dashboards and time‑based heatmaps visualize CPU, memory, disk, NXDOMAIN, SERVFAIL, and query traffic to correlate anomalies with changes or events. Model-aware anomaly indicators and the topology view let teams quickly isolate affected appliances or sites for focused remediation.
How does DDI Analytics streamline operational visibility and management of noisy DHCP clients and licensing compliance?
DDI Analytics includes DHCP talker analytics to identify clients that request or release IPs far more frequently than expected, which helps teams isolate misconfigured devices, faulty hardware, or high‑churn IoT deployments and reduce DHCP load to prevent lease exhaustion. For licensing and compliance, the License Meter dashboard pulls dynamic counts of Address Managers, BDDSes, Edge assets, and IP usage against entered entitlements, highlighting overuse or approaching thresholds. Together with ignore lists for expected full ranges and navigable topology tags and fields, these features focus operational effort on real risks and simplify capacity budgeting and governance.
The solution: DDI Analytics
DDI Analytics, an add-on for Integrity, BlueCat’s DDI management solution for enterprises, embeds a visualization-first analytics tool directly inside Integrity. It maps your entire DDI environment—including your BlueCat Address Manager, BlueCat DNS/DHCP Servers (BDDSes), DNS/DHCP services, locations, and cloud DNS—into a single interactive view.
Network teams can start at a live topology, filter by service or site, and drill into global or appliance dashboards, heatmaps, or zone-level details with a click. Real-time metrics, model-aware thresholds, and anomaly indicators highlight hotspots instantly, while built-in forecasting predicts capacity constraints before they impact users.
Whether analyzing DHCP churn, tracking DNS performance, or reviewing Top-N utilization, DDI Analytics centralizes insights alongside the tools teams already use to manage core DDI.
Features
DDI global dashboard
View system-wide key performance indicators on a global dashboard, including queries per second, leases per second, active IPs, and Top-N block, network, and range utilization. Ignore lists remove ranges that are full by design, so teams can focus on real risks. The result is a clean, accurate picture of capacity trends across your entire Integrity deployment.
Capacity forecasting
Built-in forecasting uses recent history to predict utilization, helping teams catch saturation trends early. These projections enable safer upgrades, DHCP range planning, and proactive resource allocation before users experience impact.
Cloud DNS analytics
Get visibility into external DNS traffic with total queries, average queries per second, and geographic heatmaps by data center. Drill down by zone, query name, query type, return code, source IP, or destination IP to investigate spikes, routing issues, or suspicious activity, including any distributed denial-of-service events.
Appliance dashboards and heatmaps
Each BDDS includes thresholds based on its model, instantly highlighting load or error conditions. Time-based heatmaps visualize CPU, memory, disk, NXDOMAIN, SERVFAIL, and query traffic, helping network teams pinpoint anomalies or correlate spikes with changes, deployments, or external events.
DHCP talker analytics
Identify clients that request or release IP addresses far more frequently than expected. These so-called noisy talkers often indicate misconfigurations, faulty devices, or high churn IoT deployments. Network teams can reduce DHCP load and prevent lease exhaustion by isolating these sources of noise.
License meter dashboard
Track how many Address Managers, BDDSes, Edge assets, or IP counts are in use compared to licensed limits. Customers enter entitlements once; actual asset counts are pulled dynamically to show overuse or approaching thresholds. Along with automated DDI Analytics license detection, this is useful for budgeting and compliance.
Whitespace analysis
Visualize IP blocks, networks, and unused ranges to understand how address space is distributed and where new networks can be placed. Teams can see fragmentation, available space, and subnets at a glance—dramatically simplifying network planning efforts.
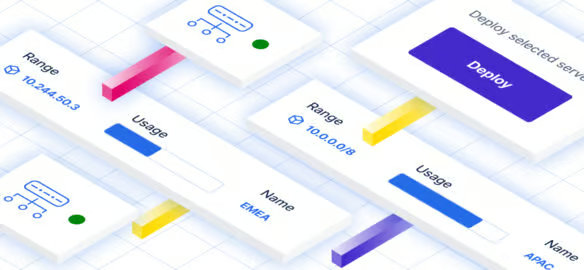
Visualization-first topology
Filter a navigable topology of your DDI environment to show Address Manager, BDDSes, and active DNS/DHCP services, along with topology connectors—such as crossover high availability (xHA) and DHCP failover links—using tags, sites, and user-defined fields. Start from the topology to explore health, performance, and alerts across the environment, and then drill into specific appliances or dashboards with a single click.
BlueCat’s Intelligent Network Operations (NetOps)
BlueCat’s Intelligent NetOps solutions provide the analytics and intelligence needed to enable, optimize, and secure the network to achieve business goals. With an Intelligent NetOps suite, organizations can more easily change and modernize the network as business requirements demand.