How to monitor F5 devices – SNMP vs API vs SSH
What is the best way to monitor F5 devices? Is it best to use SNMP, SSH or an API connection? See how indeni monitors these devices for optimal performance.

Notice: This blog post was originally published on Indeni before its acquisition by BlueCat.
The content reflects the expertise and perspectives of the Indeni team at the time of writing. While some references may be outdated, the insights remain valuable. For the latest updates and solutions, explore the rest of our blog
This article compares three F5 monitoring interfaces—iControl REST, SNMP, and TMSH—by running continuous tests against an F5 device to determine which method delivers accurate metrics with the least operational impact. The authors executed repeated command-runner scripts over ~20 minute intervals across different pool counts and measured GUI responsiveness, timeouts, metric completeness, and system resource effects (memory/swap). The outcome: REST provided the most reliable, complete metrics with minimal GUI disruption, SNMP was second but lacked some metrics and truncated long pool names, and TMSH consumed excessive memory/swap causing timeouts and GUI sluggishness.
How were the monitoring methods tested and what commands were used?
Each method was exercised continuously for roughly 20 minutes using command-runner scripts while observing the F5 web interface for responsiveness. For REST the script loop executed: command-runner.sh full-command –basic-authentication user,password rest-pool-statistics.ind 10.10.10.10. For TMSH the test used SSH to run: command-runner.sh full-command –ssh user,password ./show-ltm-pool-detail-raw-recursive.ind 10.10.10.10. For SNMP the SSH-based script was: command-runner.sh full-command –ssh user,password ./snmp-pool-statistics.ind 10.10.10.10. The GUI was monitored during runs and additional longer graphs (4-hour and 24-hour) were referenced.
What differences in results and operational impact were observed among REST, SNMP, and TMSH?
REST produced results consistently with no GUI timeouts in both full and reduced runs and only once caused management interface sluggishness (likely due to prior TMSH-induced swap pressure). SNMP always returned results without GUI timeouts but sometimes truncated long pool names and did not expose the same metric set (missing pool state and availability in a single command). TMSH intermittently timed out, produced gaps in the metrics graphs, sometimes failed to return results, required reducing metrics to succeed, and consumed significant memory and swap, negatively affecting overall system responsiveness.
Why did the testers rerun REST with fewer pools and how did that affect the comparison?
The original REST test ran against 283 pools, but the TMSH attempt timed out when run against that many pools. To ensure a fair comparison across methods, the team reduced the pool count to the original 83 and reran REST (and ran TMSH and SNMP against 83). This normalization allowed equitable assessment: REST still performed reliably at 83 pools, SNMP returned results but lacked some metrics, and TMSH continued to show instability and high memory/swap usage, which disqualified it from being a suitable monitoring method in these tests.
F5 has many ways of interfacing with their products and when writing monitoring we had to do some research which one is more suitable in terms of performance. After all, monitoring should not harm the device it monitors. When choosing methods we looked into iControl REST, SNMP and TMSH. See below for how this test was conducted and which one won.
The best way to monitor F5 – How the test was conducted
We ran each type ~20 minutes continuously through command-runner. While running the tests the web interface was used to make sure that the web interface responsiveness was up to par.
The commands to run each test
#REST
while true; do
command-runner.sh full-command –basic-authentication user,password rest-pool-statistics.ind 10.10.10.10
done
#tmsh
while true; do
command-runner.sh full-command –ssh user,password ./show-ltm-pool-detail-raw-recursive.ind 10.10.10.10
done
#SNMP
while true; do
command-runner.sh full-command –ssh user,password ./snmp-pool-statistics.ind 10.10.10.10
done
Results
The test started out with 283 pools (with 200 additional ones created just for this test). However, when trying the tmsh command, command-runner timed out, so we had to reduce to the original 83 pools and rerun the test using rest to make it fair.
- Test 1: REST = 283 pools
- Test 2: Tmsh = 83 pools
- Test 3: SNMP = 83 pools
- Test 4: REST (take 2) = 83 pools
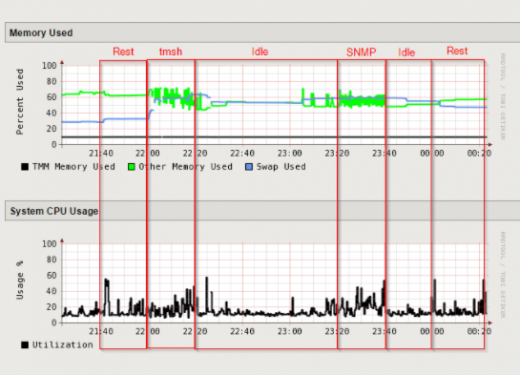
4 hour graph
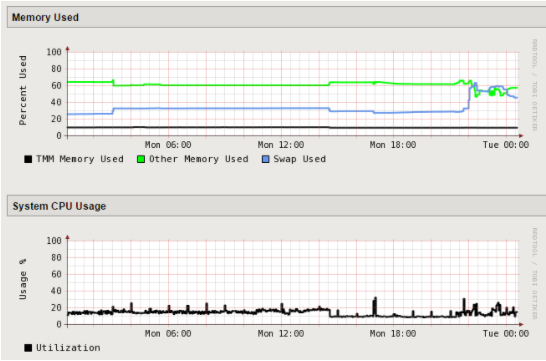
24 hour graph for reference
REST
- Did not produce any timeouts in the GUI in any of the two tests.
- Always produced results.
- Management interface only became sluggish one time during the second attempt. Most likely because of the already high swap usage created by the TMSH tests.
TMSH
TMSH produced these once in awhile:
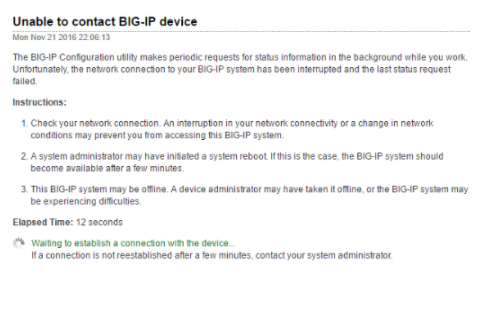
- When that happened you can see the gaps in the graph. It is unknown what the gap after the graph was because we was working on the snmp metrics at that time.
- TMSH also failed to give results sometimes.
- Forced to run with fewer metrics than rest in order to even get a result.
SNMP
- Truncated the pool names sometimes. It is unclear why ast was always done on long names, but different lengths.
- Did not produce any timeouts in the GUI.
- Always produced results.
- Did not have as many metrics as REST since the exact same metrics was not available in one command (pool state and availability is missing).
- Management interface became a bit sluggish on and off.
Conclusion
Over all REST won the test with SNMP as second. TMSH did not even qualify as it takes up very large amounts of memory and swap which negatively affected the overall system.
Thank you to Patrik Jonsson for contributing this article.
Related content

We bet on Intelligent NetOps two years ago. Infoblox now has too.
With Infoblox acquiring Kentik, BlueCat’s CEO confirms its vision for a single platform unifying DDI, network monitoring, and observability.

BlueCat DDI data boosts Cisco Cloud Control AI-driven operations
BlueCat’s integration with Cisco Cloud Control provides AI agents with access to trusted DDI data for network investigation and remediation.

Automate your DDI modernization path by migrating with Micetro
Automate cross-platform DNS and DHCP migration with Micetro to reduce risk, eliminate manual effort, and modernize infrastructure faster.

How to map your network with user-defined links in Integrity X
Map your network with user-defined links in Integrity X to define and manage custom relationships, such as dual-stack and NAT environments.