End-to-end observability and intelligence
Visualize, understand, and optimize the performance of your network and applications in real time
One simple platform for global network observability and intelligence
LiveNX visualizes the performance of all the data moving across your entire network in one easy-to-use interface.
It collects, correlates, and presents high volumes of complex application and network data in an intuitive view, allowing NetOps teams to take specific actions that improve performance and drive business outcomes.
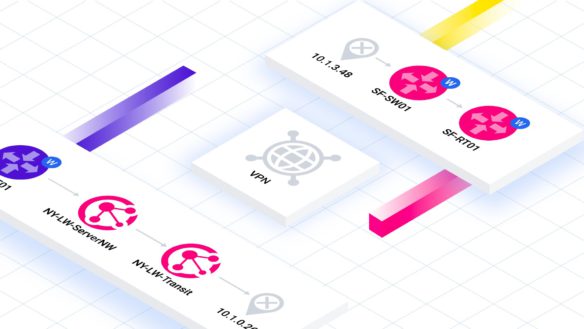
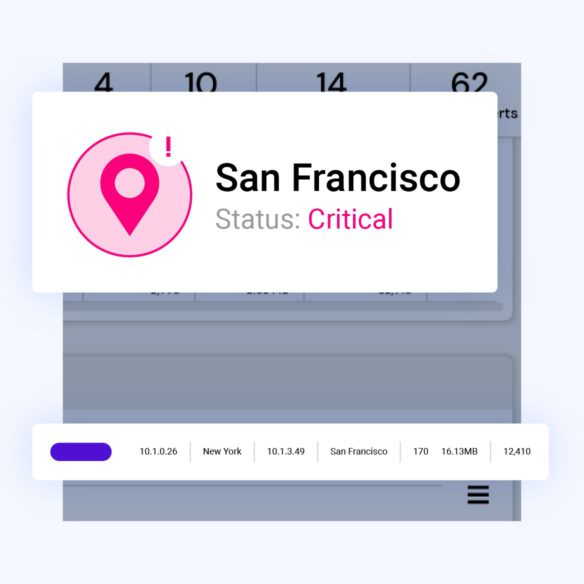
Establish a real-time picture of your total network health and drill down to a specific location, single hop, or even an individual packet with just a few clicks.
LiveAssist: Your AI copilot for network operations
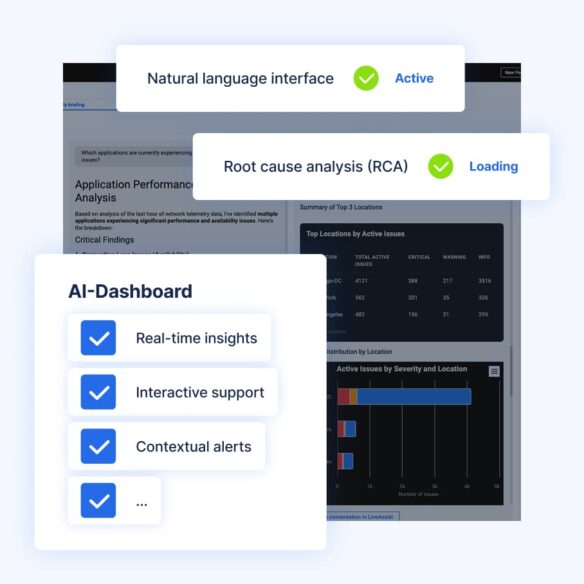
BlueCat LiveAssist is an AI-powered LiveNX add-on that transforms how NetOps teams detect, troubleshoot, and prevent issues.
With real-time insights, automated root cause analysis, and natural language interaction, LiveAssist empowers every engineer to work like an expert — reducing downtime, cutting through noise, and strengthening security.
What you can do
Achieve network-wide observability
See real-time, dynamic network topology maps and path visualization across on-premises, SD-WAN, cloud, and hybrid networks to understand what’s happening exactly as it happens.
Proactively optimize performance
Automatically find, troubleshoot, and remediate performance and security issues across the applications that drive your organization—such as VoIP, video, network, and SD-WAN—with advanced analytics and reporting.
Unify real-time network data
Build a single picture of detailed flow and packet data analysis to get insights into traffic patterns and bandwidth utilization.
I want to …
LiveNX benefits
See all your network data on one platform
Unify data across WAN, SD-WAN, Wi-Fi, data centers, and multicloud. Automatically discover devices, correlate data sets, and visualize performance with maps and graphs to get one view of your applications, infrastructure, and tunnels from a single centralized platform.
Get a true baseline of global network performance
Get network and application performance overlays for every device, interface, application, VPN, and user on your network to understand what ‘normal’ looks like, and proactively identify and prevent deviations in real time.
Application monitoring and troubleshooting
Diagnose complex issues across systems, vendors, and devices to resolve incidents faster with predictive insights, alerts, and guided incident response workflows.
Integrated flow and packet-level analysis
Seamlessly drill down from flow visualization to packet-level analysis for root cause investigations. Inspect packet payloads, view packet-by-packet ladder diagrams, and accelerate troubleshooting with optimized flow-to-packet workflows that connect high-level views to granular details.
Reports and dashboards
Monitor network health and trends with simplified dashboards and out-of-the-box reports. Easily track bandwidth usage across sites, devices, and users, and generate security analysis reports to help identify risks and guide security improvements.
Monitoring, alerting, and management
Get real-time visualization of quality of service anomalies, traffic classification issues, and IP telephony metrics like jitter, latency, and call quality. Manage SD-WAN performance and ROI using application and path visualizations, with real-time data across multi-vendor environments.
Frequently asked questions
LiveNX is an enterprise-grade network observability and intelligence platform by BlueCat Networks. It provides end-to-end visibility into your network traffic and application performance across on-premises, SD-WAN, cloud, and hybrid environments.
LiveNX helps network teams manage complex, distributed networks by unifying data from devices, applications, users, VPNs, and tunnels into a single view. It simplifies troubleshooting by letting engineers drill down from a global network view to specific hops or even individual packets, reducing downtime and accelerating root cause analysis.
LiveNX offers real-time dynamic network topology mapping and path visualization, unified flow and packet-level data collection, integrated application performance monitoring for UCaaS and SaaS, as well as capacity planning, dashboards, alerts, and reporting for QoS, IP telephony, bandwidth usage, and device utilization.
LiveNX enables network teams to move quickly from high-level performance anomalies to detailed traffic flows and packet-level insights. This reduces the mean time to detect and resolve issues impacting applications, VoIP, bandwidth, and user experience.
Yes. With the LiveAssist add-on, LiveNX provides an AI-powered copilot for network operations. It delivers real-time insights, automated root cause analysis, and natural language interactions to help engineers detect, troubleshoot, and prevent network issues more efficiently.
LiveNX is designed for organizations with complex, distributed, hybrid, or multicloud networks, including enterprises and service providers that need unified, real-time visibility, deep application performance monitoring, strong troubleshooting tools, and effective capacity planning.
LiveNX supports on-premises data centers, SD-WAN deployments, hybrid cloud environments, remote and branch offices, Wi-Fi networks, VPNs, and multicloud architectures.
Traditional tools focus mainly on device-level metrics. LiveNX combines device metrics with application-level data, traffic flows, packet analysis, and user context in a single interface. This makes it better suited for modern networks that mix cloud, SaaS, and hybrid architectures.
Yes. LiveNX is built to scale across large, distributed, multi-vendor environments. It can aggregate high-volume network and application data from multiple locations while still enabling both global overviews and granular analysis.
Resources

Network forensics with BlueCat LiveWire
This demo shows how LiveNX reporting and LiveWire packet capture work together to accelerate root cause analysis and incident investigation.

Security Insights for network security at the edge without complexity
For LiveWire and LiveNX users, analyze flow and packet telemetry for faster threat detection, stronger forensics, and shared visibility.

BlueCat Networks unveils channel-first strategy with launch of BlueCatalyst Partner Program
The BlueCatalyst Partner Program provides the support, resources, and incentives to solve your customers’ critical network challenges.