Deepen your security insight with LiveAssurance 8.3
BlueCat LiveAssurance 8.3, with an enhanced analytics dashboard, including interactive widgets and top 10 alerts, is now available.

Key Takeaways
For IT operations teams looking to get deeper insight into their security infrastructure, BlueCat LiveAssurance 8.3, with an enhanced analytics dashboard, is now available.
The result of BlueCat’s acquisition of Indeni, BlueCat LiveAssurance (BCIA) auto-triages issues in your firewall environment. Informed by vetted, community-sourced experience, it collects relevant data from your security infrastructure components and analyzes it according to known best practices. It automatically alerts you to identified issues and provides recommended actionable remediation steps.
IT operations teams can avoid costly outages if they receive advance notice about common issues that can lead to bigger problems.
In this post, we’ll highlight the enhancements in the 8.3 release to BlueCat LiveAssurance’s analytics dashboard, including interactive widgets and top 10 alerts. Then, we’ll briefly note other usability enhancements. And finally, we’ll provide details about several new automations and alerts for a few supported devices.
Introducing an enhanced BlueCat LiveAssurance analytics dashboard
Earlier this year, we set out on a mission to create an analytics dashboard for BlueCat LiveAssurance.
We conducted a technical analysis of our customers’ alert export data, that, in part, inspired and informed our mission. The analysis yielded numerous discoveries. For example, we identified supported devices that were frequently problematic, as well as top alerts.
Our customers’ feedback was overwhelmingly positive and provided our analysis with a wealth of information. From it, we made well-informed, data-based decisions about dashboard capabilities. We also further optimized the BlueCat LiveAssurance user environment and identified new projects for future releases.
New dashboard widgets and improvements to existing widgets
Our alert export data analysis led to the development of many new widgets and improvements to existing widgets. On this final leg of our analytics dashboard journey in the 8.3 release, we rearranged widgets, made every widget interactive, and added a new widget for top 10 alerts.
With these enhancements, you can perform your own similar technical alert export analysis using the analytics dashboard.
Watch this short video below for a brief overview on how you can leverage the dashboard’s new widgets and features to quickly process information about potential problems in your environment.

Viewing your top 10 alerts
Identifying your top alerts helps you quickly understand the most common issues in your environment. It also helps you identify areas for optimization, such as tuning the thresholds of your alerts.
This was one of the key focus areas in our alert export technical analysis. Now, with a widget for top 10 alerts, you can prioritize your troubleshooting effort based on the severity and frequency of issues.
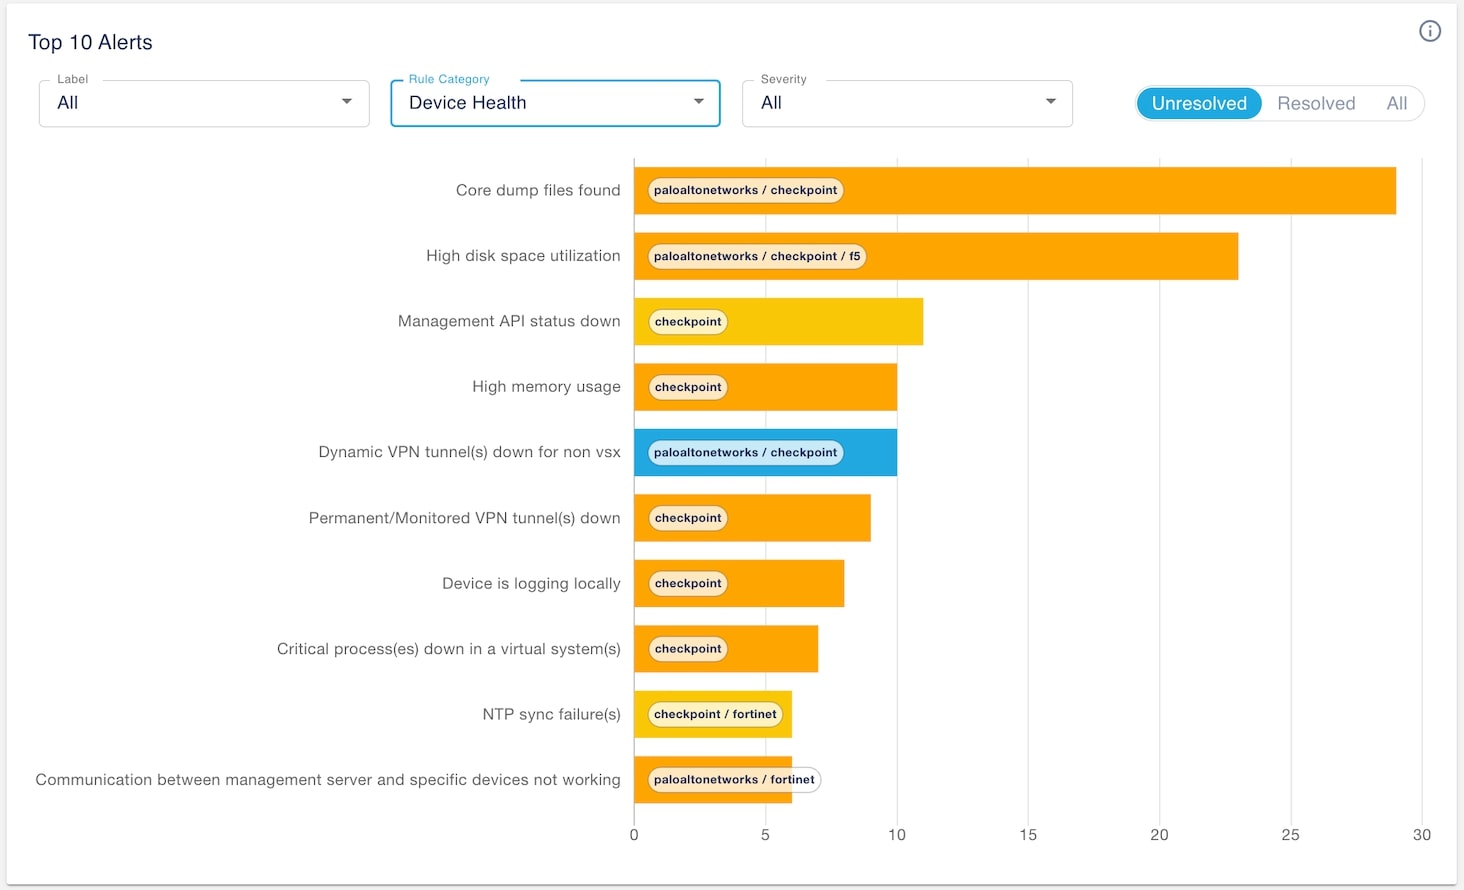
For example, using the screenshot above, let’s say that you want to identify the 10 most common device health issues across your environment. By setting the Rule Category to Device Health, you can see that numerous core dump files were found in your Palo Alto Networks and Check Point firewalls.
This dashboard is highly interactive. It lets you ask questions and interact with data to gain deeper insight into your infrastructure.
You can narrow your analysis by using labels (the default is system-all) to limit the data to a subset of devices. Or you can filter by severity. Furthermore, you can filter for unresolved issues (which is the default), resolved issues, or both. And you can drill down to explore an issue further by clicking any bars in the dashboard chart.
New automations and alerts in 8.3
In addition to BlueCat LiveAssurance’s significant usability enhancements in 8.3, the release also offers several new automations and alerts for a few supported devices. Here are the details.
BlueCat Integrity
New automations and alerts in BlueCat LiveAssurance for Integrity customers include:
- High service CPU usage detection
- DNS lookup failure(s): Testing the DNS service among DNS servers to ensure the servers are healthy
- Large, accumulated WAL file size or large number of accumulated WAL files (BlueCat Address Manager only)
- Communication among DNS servers not working: The network often causes DNS service disruptions. For example, if a firewall policy change causes communication issues between the primary and secondary DNS servers, it can potentially lead to zone transfer failure. Proactively verifying that the ports and protocols are working between the servers can prevent an outage.
- DHCP statistics for graphing and reporting
- Automatic troubleshooting of an NTP sync failure problem to identify the root cause
Broadcom Symantec (formerly Blue Coat) ProxySG
Broadcom Symantec ProxySG users will now receive an alert if the device stops sending syslogs to the syslog server.
Check Point Quantum Security Gateway and Quantum Maestro
New BlueCat LiveAssurance automations and alerts for the Check Point Quantum Security Gateway and Quantum Maestro lines include:
- Generic Data Center objects external server not reachable: You can enforce access to and from IP addresses defined in files located on external web servers. BlueCat LiveAssurance alerts if a secure gateway cannot access the external server for its policies.
- Admin login table for locked objects: Performing tag revision can lock objects, eventually causing a firewall failure. Although hotfixes are available to address the locked objects issue (see Solution ID sk169772 from the Check Point Support Center), BlueCat LiveAssurance will verify if hotfixes have been applied. If not, it will identify if locked objects are found.
- Monitor contract file size: A contract file is an encrypted text file that contains a list of service contracts. However, large cp.contract files can cause device instability. BlueCat LiveAssurance considers a file size of more than 1.5MB too large and alerts when it detects it. You can adjust the file size threshold as well.
- Monitor Multi-Domain Log Server log rate: BlueCat LiveAssurance alerts when the log rate is more than a certain percentage greater than the indexer rate. The default is set to 10%, but you can change the default threshold to suit your needs.
- Identity Collector: Tracking when ID Collector is no longer sending updates.
Palo Alto Networks Next-Generation Firewalls
New BlueCat LiveAssurance automations and alerts for Palo Alto Networks Next-Generation Firewalls include:
- Dynamic Address Group tags approaching limit: While high-end devices can support over 100,000 tags, low-end devices can only support 1,000. When devices are maxing out their capacity, the registration process stops working. With BlueCat LiveAssurance, you can now define a threshold to receive an alert when tags are reaching a certain percentage of maximum capacity based on the device model.
- Retrieving a list of top talkers periodically from Panorama (metrics only): A list of top talkers is useful for troubleshooting issues like high CPU or high bandwidth utilization. This information will be available in the future from our long-term time series database.
- Generating alerts if Common Vulnerabilities and Exposures (CVEs) are detected: Numerous CVEs for PAN-OS were published in 2023.
Ready to see the enhanced dashboard in BlueCat LiveAssurance 8.3 for yourself? Request a live demo today.
Published in:

Ulrica de Fort-Menares is the Vice President of Product Management for Infrastructure Assurance.
Related content

Your journey to intelligent NetOps begins at Cisco Live
Visit BlueCat’s booth or book a meeting now to learn more about how our solutions can help you build a network that supports constant change.

Replace BIND and ISC with Micetro DNS/DHCP Server (MDDS)
Tired of patching and manually configuring BIND DNS and ISC DHCP? Discover how Micetro MDDS appliances can replace them for modern DDI.

Automate it all in Integrity with REST v2 API-first DDI management
Discover API-first DDI with Integrity X by using REST v2 to automate DNS, DHCP, and IPAM for scalable, secure network operations.

Agentic AI adoption in network observability propels NetOps teams
Network observability is crucial for today’s networks and even more capable with agentic AI, according to new Omdia and BlueCat research.