How to visualize network state data for stakeholders
With REST APIs and CLI parsers, present your network state data in a variety of consumable ways for developers and stakeholders. Learn how with BlueCat.

One of the many disruptions to the DevOps approach to infrastructure is the need to democratize and liberate network state data from traditional network administrators and get it into the hands of modern developers.
Some of these developers and analysts may not have any formal network training. Or they may have never even seen a command-line interface (CLI). But they are being asked to develop automation solutions that involve network state data nonetheless.
Furthermore, beyond developers who are now engaging in infrastructure problem solving, there are many stakeholders with a vested interest in gaining access to network state data as well. This includes finance and procurement, compliance, information security officers and security teams, frontline operations, network operations centers, help desks, and even CTOs and CIOs.
Traditionally, there have been numerous obstacles for these stakeholders in both gaining access to network state data and trying to make sense of it in the context of their organization’s needs. Years at the CLI or industry certifications were often a prerequisite.
This post will define what network state data is and why there is an exponentially growing number of interested parties who can make use of it. Further, it will explore creative ways to present the network state that reduce or completely eliminate historic barriers. It will demonstrate how to make business-ready artifacts that stakeholders can easily consume without any need for training.
What is network state data and why do stakeholders care?
Traditionally, network state data is thought of as CLI-standard output used by network engineers to establish, at a point in time, the overall operational health, configuration, and state of various interfaces, tables (MAC address, address resolution protocol [ARP], routing), and counters (cyclic redundancy check [CRC] errors, input/output rates).
With the arrival of both REST APIs and CLI parsers, this output can now be standardized into structured data—typically JavaScript Object Notation (JSON). As you will see, there is an infinite number of ways to use these, including for configuration management, software versioning, operational health and state, and link utilization. There is a wealth of information just waiting to be capitalized upon.
In this post-DevOps world, more and more developers—not just network operators—are interested in the state of the network.
IT security has always had a vested interest in harvesting the network state for clues about security posture and potential risks. Finance, procurement, and asset management rely heavily on not just the state of routers and switches but the serial numbers and contractual status of the infrastructure. And, of course, frontline support wants to quickly rule out (or confirm) that ‘the network’ is to blame for incoming incidents.
Let’s face it: Network state is the ‘big data’ you have been hearing about for almost a decade now. The problem is that, like crude oil buried under layers of rock, nobody has taken the time to find a way to access and refine this valuable commodity.
Connecting, gathering, and presenting network state data
Our first challenge is to establish a secure, agentless connection to our network infrastructure programmatically. If the platform is modern, it may provide a REST API that allows you to get structured data back from the device without the need for the command line. If that’s the case, this step is optional.
However, if you are like most networks, you likely do not have REST APIs on your platforms or you may have never enabled the feature. BlueCat Address Manager and BlueCat Gateway definitely have a working, high-value REST API that we demonstrated together.
Use Python whenever possible
I am a strong proponent of using Python whenever possible to build network automation solutions, as well as a tool like Scrapli or the pyATS framework to establish SSH connectivity to the network.
Scrapli is a Python library developed by Carl Montanari. It simplifies the process of connecting to devices (typically network-based) via Telnet or SSH for the purpose of sending commands and screen scraping. The pyATS framework is Cisco’s open-source network testing framework. If you are not ready for Python you could also use Ansible to achieve this.
A working example of Python and pyATS
Before we get into the various visualizations, here is the Python I use, utilizing the pyATS framework and library, to connect, parse, and transform CLI -> JSON -> Markdown -> Mind Map with Jinja2 templates.
pyATS has both a job file and the actual Python file.
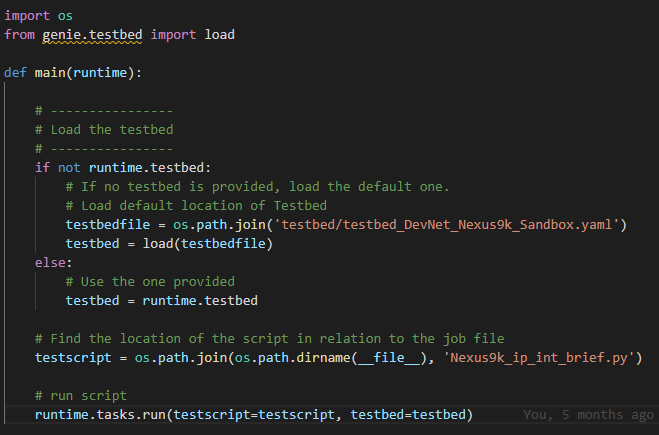
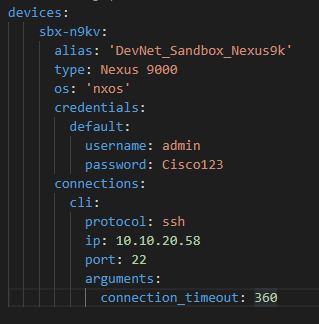
This file calls the Python file, where it executes the logic itself. You will notice this file references a testbed, which is a YAML file that holds the information about the device needed to establish an SSH session.
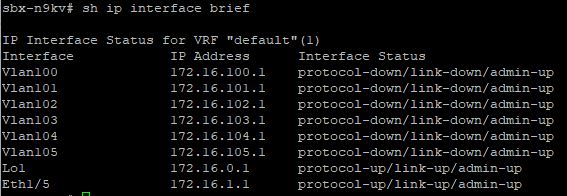
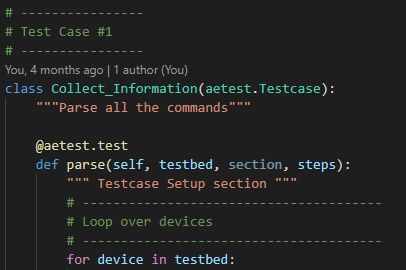
Back to our show_ip_interface_brief.py file—the main attraction—where we can connect to all devices defined in the test.
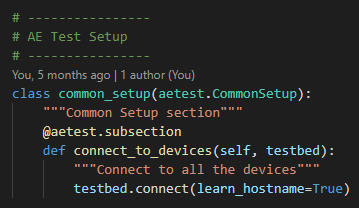
Now, we can loop over each device in the testbed and perform tests.
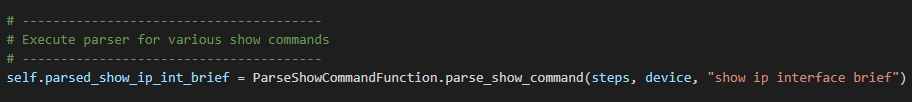
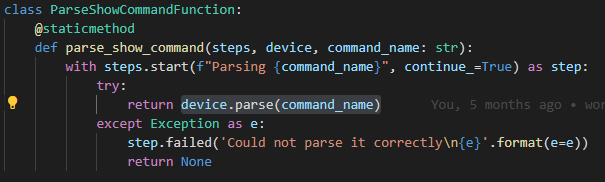
We are now ready to parse the show command into JSON. Because I do this step so often in my work, I have made a re-usable function inside a static class that I can pass commands to for parsing.
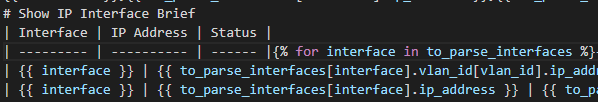
In order to make a Markdown, for example, we can use a Jinja2 template.


Parsing the CLI
Now that we have connected to our device, we will want to use a parser to perform the complex regular expression (RegEx) behind the scenes that transforms the standard CLI output into structured data.
Much like everything else in the world of Python, we have options here. Personally, I like to use the pyATS libraries (formerly called Genie), but there is also TTP (Template Text Parser), TextFSM, and others available. The idea here is to get structured data, ideally JSON, back from the device.
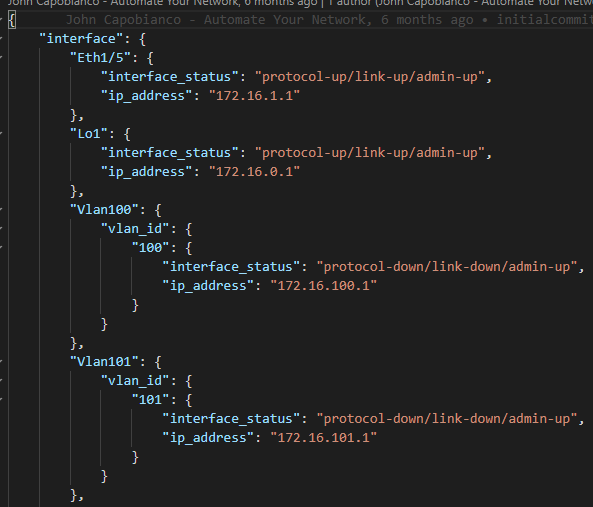
JSON
JSON is both a solution itself as well as a foundation all other presentations rely on. With this powerful structured data, we can basically do whatever we want with it. Most developers will understand this format and all other Northbound REST APIs (other APIs we want to send the data to for further interactions and automation). This makes it a perfect format to store network data.
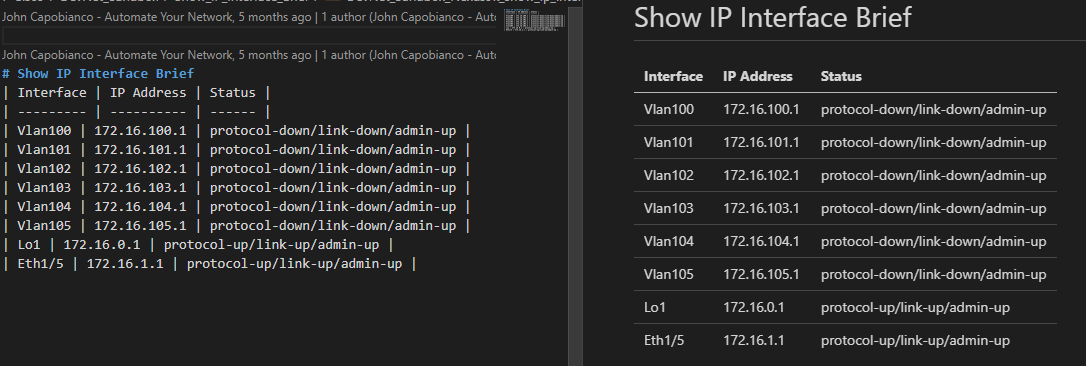
As you can see, the show ip interface brief command output is rather elegant when presented as JSON.
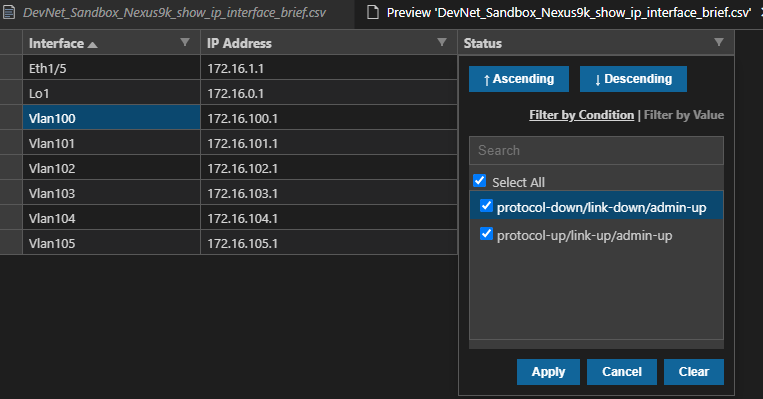
Comma-Separated Values (CSVs)
The power of a spreadsheet is undeniable. It is the most universal format to consume structured data. By simply adding a header row and then CSVs, we can make searchable, sortable, filterable, ready for Excel or SharePoint, transformative network state spreadsheets. This can be as easy as using the Python CSV package. Or we can handcraft our spreadsheet using Jinja2 templating or Python itself directly.
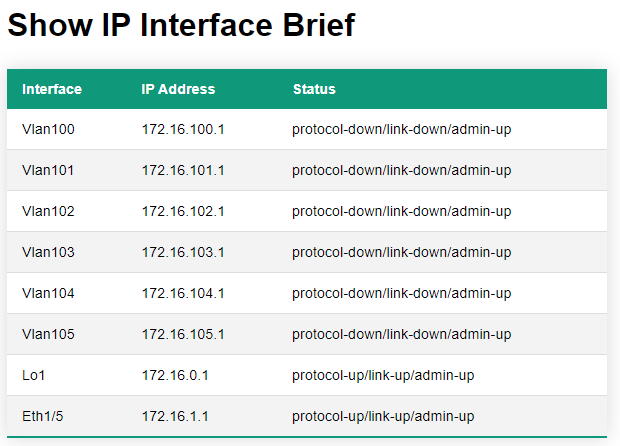
HyperText Markup Language (HTML)
Just like a CSV, HTML can tabularize the same information but make it available as a web page. The move from a CSV to an HTML table is very easy when you use tags to build a table. It’s easy to read and consume. And, most importantly, it’s easy to find with a quick URL or bookmark.
Data tables
The problem with HTML tables is that they are static; in other words, they are non-interactive. But we can overcome this limitation, free and easily, by tapping into datatables.net. This website provides ready-to-go JavaScript (JS) and Cascading Style Sheets (CSS) that you can easily include in your HTML headers and body to bring the simple HTML table to life.
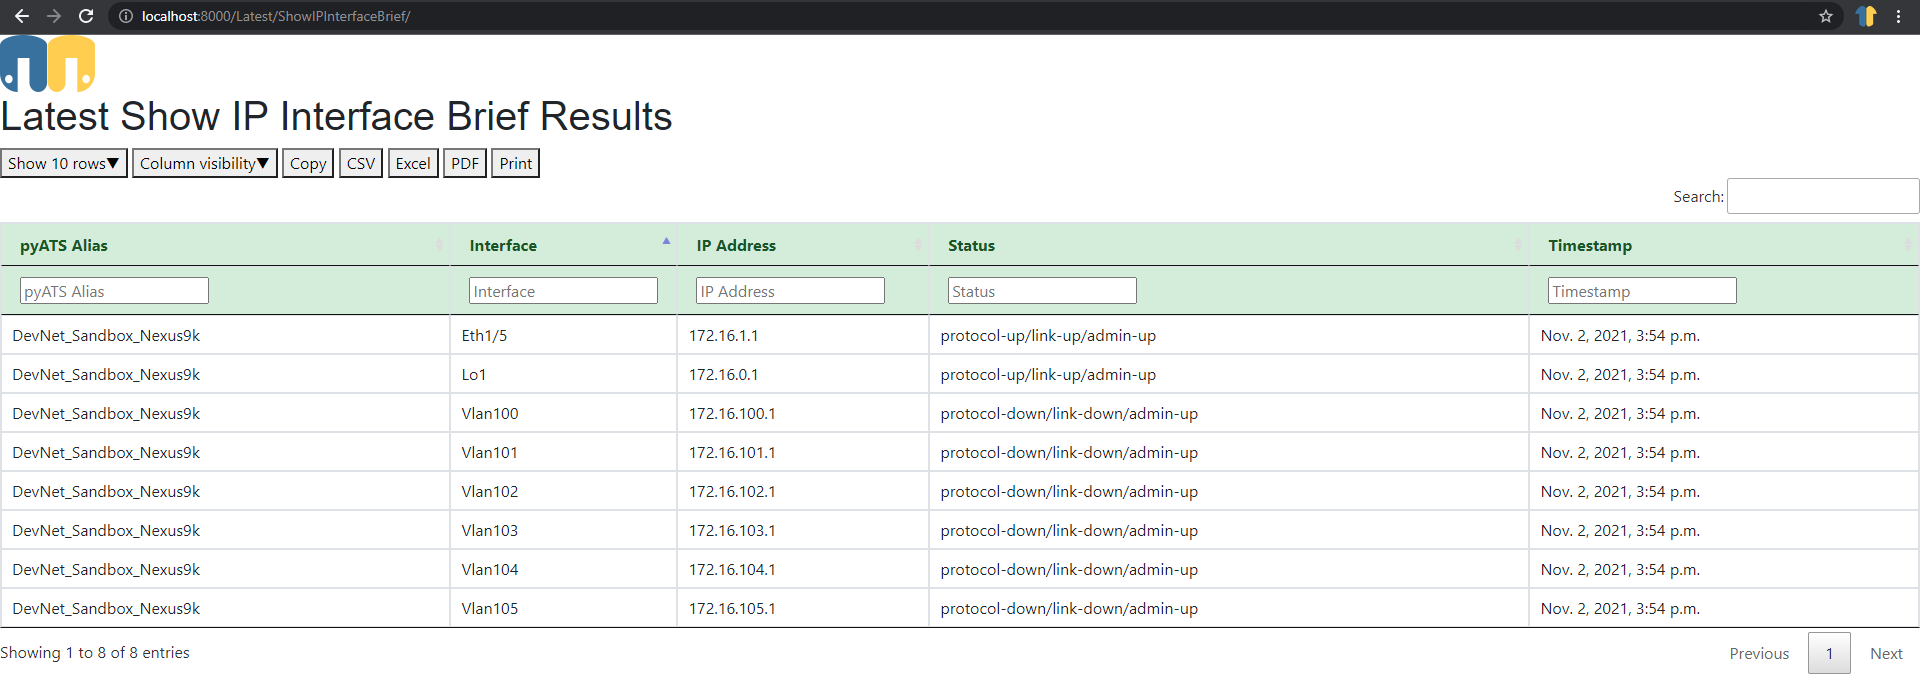
Note that the data table has added:
- Pagination
- Column visibility
- Column re-ordering
- Copy to clipboard
- CSV (hey look—a ready-to-go spreadsheet in a click!)
- Excel (macros and all)
- Print (yes, right to the printer in a click!)
- Search
- Sort/filter/find
Markdown
Another lightweight, web-ready format is Markdown. If you already have a CSV or HTML table, a Markdown file is more or less the same format but uses pipe (|) separators and a different set of tags. These files look great inside a Git repository (most READ.ME files are Markdown).
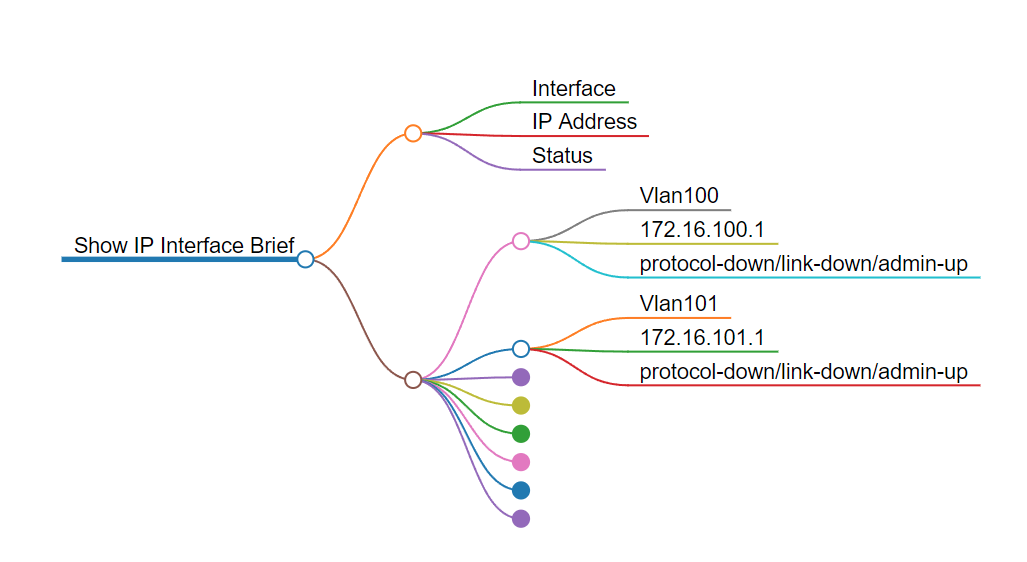
MindMap
Now that we have Markdown, we can use another free utility called markmap that will convert any well-formed (i.e., valid) Markdown file into an interactive HTML mind map. These are pretty new file types but some people really like network state data as a mind map! Take a look and judge for yourself.
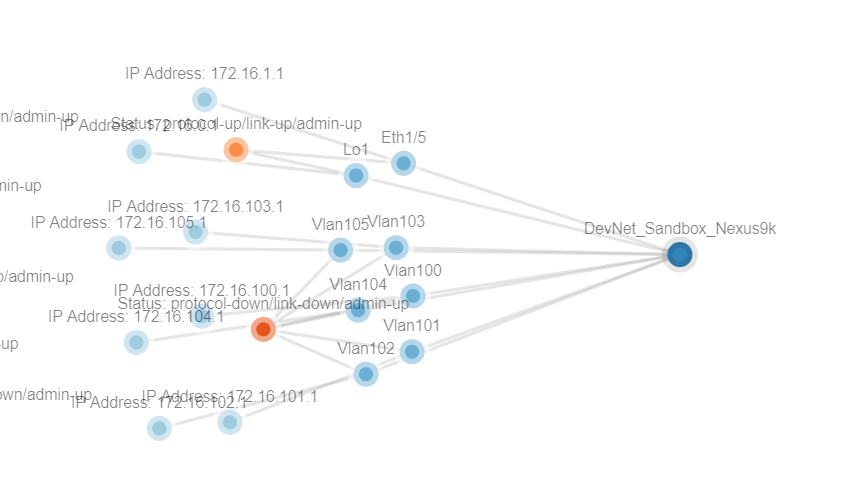
Network graph
Yet another new format we can explore, called a NetJSON graph or network graph, takes JSON in a specific format and will render an interactive HTML graph of the network state. NetJSON has a concept of nodes and links and we make the connection between the two in JSON. It then renders into this fully interactive (zoom, drag, drop, focus) HTML page.
Enterprise-ready?
Sometimes you need the presentation layers to look and feel like a commercial off-the-shelf product, in both beauty and functionality. Simply storing all of these artifacts as individual files in a file share (a UNC path on the network somewhere) is probably not quite ready for prime-time and may be more trouble than it’s worth.
There is always a question about what is or is not ‘enterprise-ready,’ as well as where to store and how to present all of these various views to stakeholders. Again, enterprise tools like SharePoint document libraries can store the CSV files while GitHub or Azure DevOps can store the Markdown. An IIS or Apache2 server can store all of the HTML pages. In fact, I have done all of this myself using Django as the Python framework!
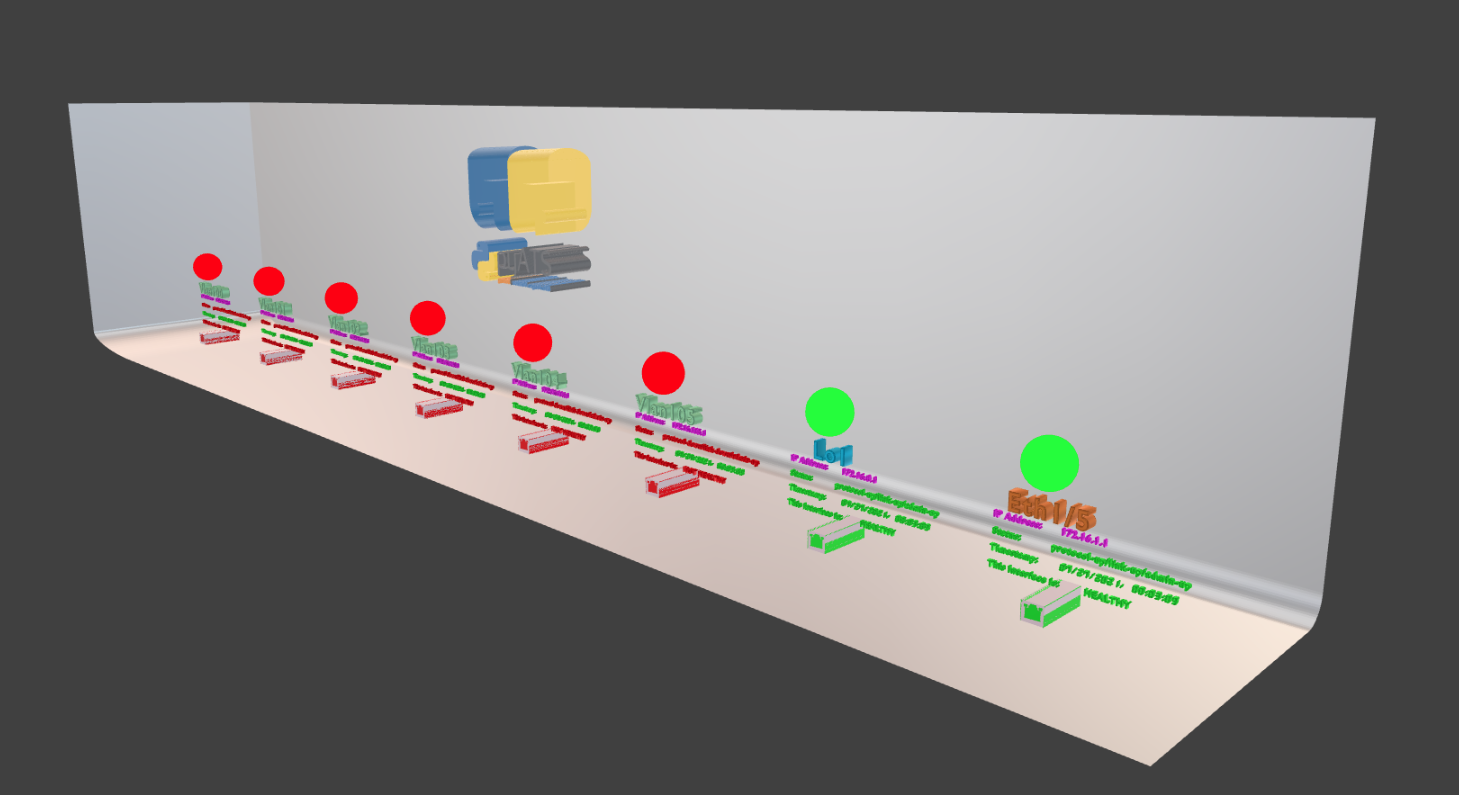
Bonus: 3D Blender
This last bonus view is definitely a new way to present data. Blender is a free and open 3D rendering and modeling tool that supports Python. Using the structured JSON, we can actually build 3D representations of the network state.
You can see my examples of Blender in action on my YouTube playlist.
Use your imagination! With the new world of Python, you can create structured data anything—all the way to online 3D representations—with network state data.
Like what you’ve read and looking for more? You can also check out my enterprise guide to network automation tools, my list of eight network automation tasks for anyone to get started, and my list of the 10 best Ansible modules for infrastructure-as-code.
Published in:

John Capobianco is the Senior IT Planner and Integrator for the House of Commons, Parliament of Canada. He is a 20-year IT professional who has fallen in love with automation and infrastructure as code. John maintains his CCNA, 2x CCNP, 5x Cisco Specialist, and Microsoft Certified ITP: Enterprise Administrator while continuously developing his programming and automation skills. He authors books and an automation-themed blog, automateyournetwork.ca. Find him on Twitter @john_capobianco or LinkedIn /john-capobianco-644a1515.
Related content

Unlock DNS Redundancy with BlueCat Micetro’s xDNS
Discover how BlueCat Micetro’s xDNS Redundancy simplifies hybrid cloud DNS management, providing seamless redundancy, robust protection against DNS…

Three technical reasons to let go of legacy tools and unify your DDI
Learn with BlueCat how security by design, cloud integration, and API programmability offer three technical reasons to adopt Unified DDI.

Combine BlueCat Integrity with LiveAction network observability for total awareness
Shift to proactive, intelligent network operations when you combine a DDI foundation with network performance monitoring solutions.

Micetro simplifies hybrid cloud DNS and IP address management
Learn how Micetro can help you simplify and streamline DNS and IP address management across hybrid and multicloud environments.