Pan(w)achrome for Palo Alto Networks firewalls from the indeni perspective

Notice: This blog post was originally published on Indeni before its acquisition by BlueCat.
The content reflects the expertise and perspectives of the Indeni team at the time of writing. While some references may be outdated, the insights remain valuable. For the latest updates and solutions, explore the rest of our blog
The article reviews Pan(w)achrome, a Chrome extension by Luigi Mori that connects to Palo Alto Networks firewalls to display vital statistics such as CPU, memory, traffic, and counters. It notes that while many vendors offer basic visualization tools (Check Point, Juniper, Fortinet), Pan(w)achrome’s browser-integrated approach makes access easier and should be further invested in by Palo Alto Networks R&D for deeper visibility. However, such extensions cannot analyze complex configurations or logs or serve as alerting systems, and the article recommends trying indeni for comprehensive configuration, log analysis, and operational data collection for Palo Alto Networks firewalls with a 45-minute setup time.
What capabilities does Pan(w)achrome provide for Palo Alto Networks firewalls?
Pan(w)achrome is a Chrome extension that connects to Palo Alto Networks firewalls and tracks vital statistics including CPU, memory, traffic, and various counters. It provides basic visualization of these operational metrics directly in the browser for easier access. The extension offers visibility into immediate performance and resource usage but does not perform in-depth configuration or log analysis, nor does it provide alerting functionality.
How does Pan(w)achrome compare to other vendors' monitoring tools?
The article positions Pan(w)achrome alongside vendor tools such as Check Point’s SmartView Monitor, Juniper’s Junos Space, and Fortinet’s web UI/FortiManager capabilities, noting that all offer basic statistics visualization. Pan(w)achrome’s distinguishing feature is its browser-integrated extension format, which simplifies access compared to standalone or appliance-based interfaces. Despite that convenience, the article emphasizes that it remains limited to metric visualization and lacks deeper analysis and alerting found in dedicated operational platforms.
Why does the article recommend using indeni for Palo Alto Networks firewalls?
The article recommends indeni because Pan(w)achrome and similar visualization tools cannot analyze complex configurations or logs, nor function as alerting systems — tasks that are outside their scope. indeni for Palo Alto Networks is presented as a solution for in-depth configuration and log analysis and comprehensive operational data collection. Additionally, the article notes indeni’s ease of deployment, stating it takes just 45 minutes to set up, making it suitable for customers needing deeper insight and automated alerting beyond what browser extensions provide.
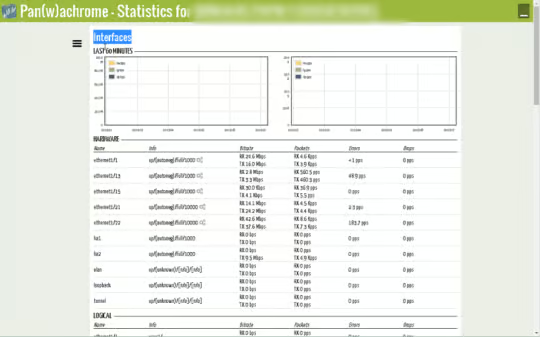
Pan(w)achrome is a chrome extension written by Luigi Mori, a solutions architect at Palo Alto Networks. The extension lets you connect to your Palo Alto firewalls and keep track of certain vital stats – mostly CPU, memory, traffic and a variety of counters.
This is a good step in the right direction – every product we support today has some sort of tool for visualizing some basic stats. Check Point has SmartView Monitor. Juniper has Junos Space. Fortinet has the capabilities in the Fortigate’s web UI as well as within FortiManager. The nice touch with Pan(w)achrome is that it’s built into the browser (through the extension) so it’s a bit easier to access.
As PAN-OS progresses (see the recent release – 7.0), we, at indeni, hope that an investment into Pan(w)achrome will be made. Firstly by taking ownership of the extension at the R&D level (and not a side project), as well as providing much deeper visibility into important elements of the Palo Alto Networks firewalls.
At indeni, we see tools like this as a great means of providing customers with some visibility. The challenge, though, is that these tools are not capable of analyzing configurations and logs (as these are too complicated and are not graphable) and cannot be used as alerting systems. It’s simply far outside their scope.
So, if you’re looking for in-depth configuration and log analysis, as well as comprehensive operational data collection, give indeni for Palo Alto Networks firewalls a spin. Takes just 45 minutes to set up.
Related content

We bet on Intelligent NetOps two years ago. Infoblox now has too.
With Infoblox acquiring Kentik, BlueCat’s CEO confirms its vision for a single platform unifying DDI, network monitoring, and observability.

BlueCat DDI data boosts Cisco Cloud Control AI-driven operations
BlueCat’s integration with Cisco Cloud Control provides AI agents with access to trusted DDI data for network investigation and remediation.

Automate your DDI modernization path by migrating with Micetro
Automate cross-platform DNS and DHCP migration with Micetro to reduce risk, eliminate manual effort, and modernize infrastructure faster.

How to map your network with user-defined links in Integrity X
Map your network with user-defined links in Integrity X to define and manage custom relationships, such as dual-stack and NAT environments.